Understanding User Segments in Google Analytics
To be able to create and analyze user segment reports in Google Analytics 4.
Prefer a shortcut? 16 free tools do parts of this for you.

Aim: To be able to create and analyze user segment reports in Google Analytics 4.
Optimal Outcome: You will be able to gain more insight into your online visitors better by creating subsets of Analytics data to define the categories that they belong to.
For instance, which subset of your users belongs to a particular country? Which of them enjoy purchasing a certain type of product or service?
What do you need to start: To follow this SOP, you will need to have a Google Analytics 4 account.
Why is this SOP Important: Looking into your user segment reports will reveal who your online visitors are. It will uncover valuable information about them such as where they live, what they purchase, and more.
This information can help you in creating marketing and sales strategies, planning your inventory, adjusting your conversion funnel to improve its efficiency, among the other processes involved in running your website or online shop.
Where to execute: You will need to set up a Google Analytics 4 account before you can create a user segment report.
Who Should Be Doing This: The person responsible for managing the site’s analytics.
What Is a User Segment?
A user segment is a subset of data that you can define and add to your Google Analytics 4 Explorations to track specific information from your website or online shop’s visitors. This includes (but is not limited to) their location, shopping preferences, and digital activity.
Execution
Resources/Tools & Set up
- A Google Analytics 4 account
Separating User Segments by US and Non-US customers.
Note: For the purposes of this SOP, we are going to create the user segment between US and Non-US customers using Google’s Merchandise Store demo account.
To access this data, go to Google’s demo account page. Select “Google Analytics 4 property: Google Merchandise Store (web data)”.
If you want to make a different user segment for the report, you can find more segment options in Creating reports for different user segments
-
Login to your Google Analytics account.
-
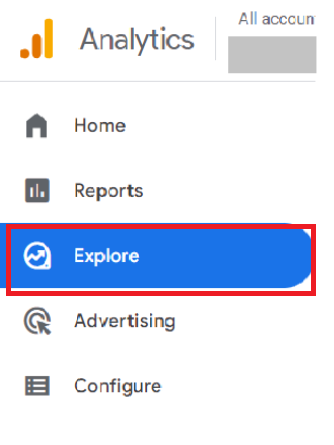
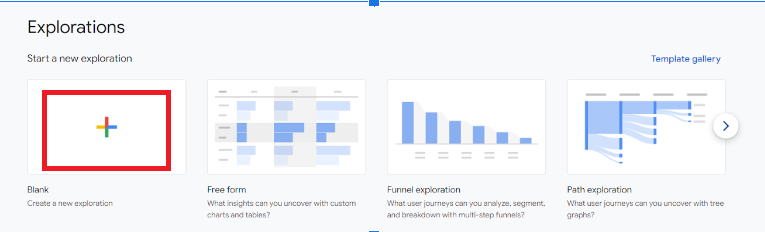
Click on Explore, then Blank to create a new exploration.
-
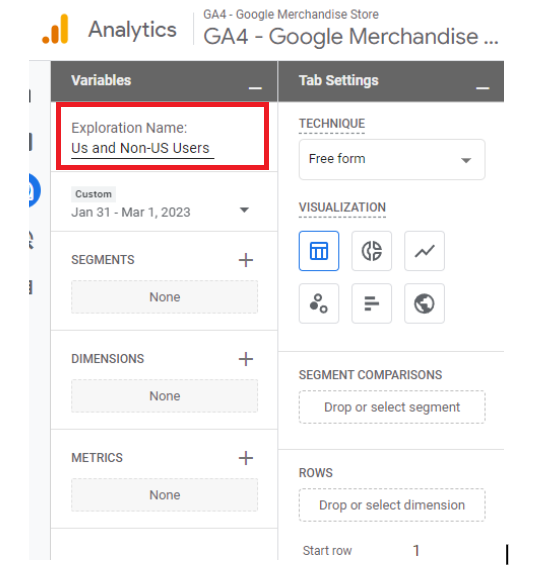
We are going to name this exploration US and Non-US Users.
-
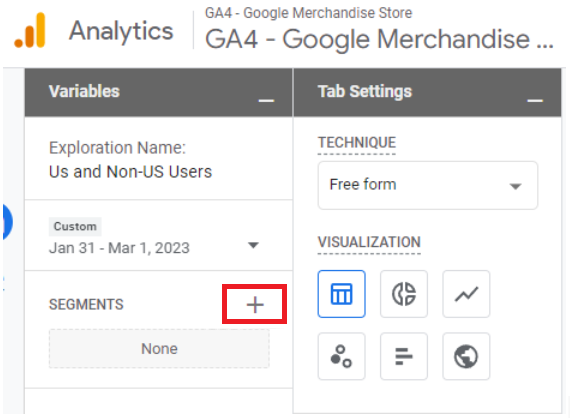
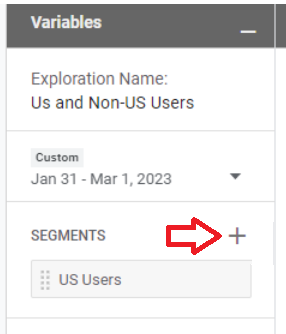
To add a segment, click on the + sign beside Segments under Variables.
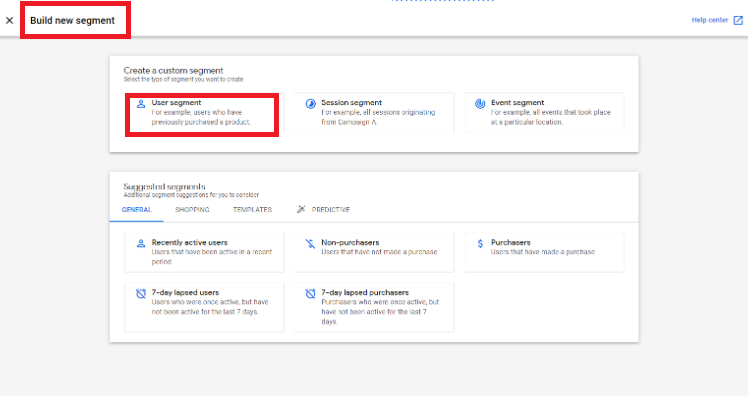
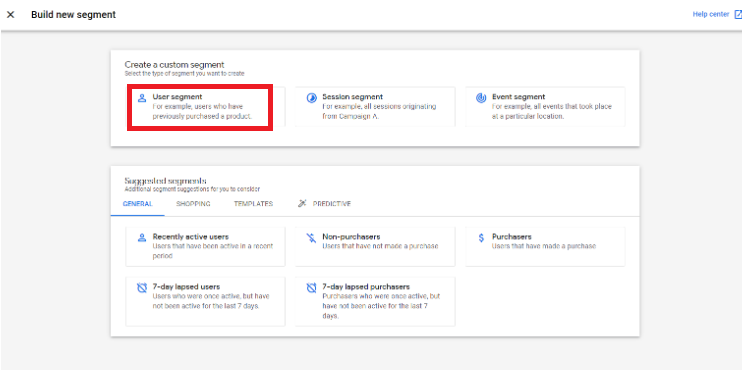
- The Build new segment page will appear. Choose User segment.
- Select a new condition to further filter the user segment.
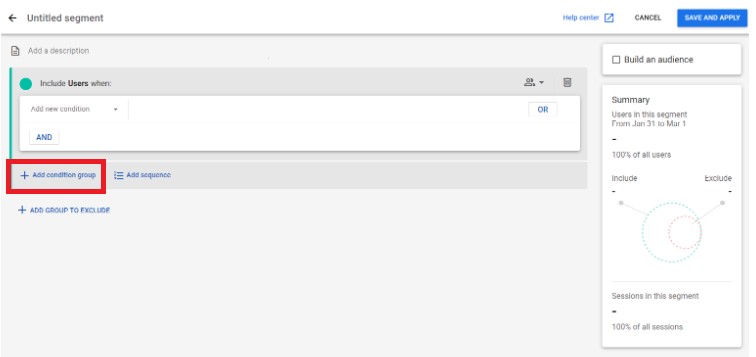
Below are other user segments that Google Analytics 4 allows you to make:
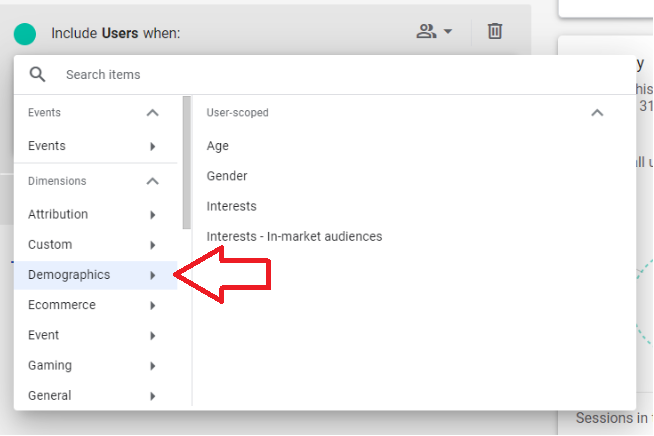
- To create a demographic-based user segment, click Demographic and its corresponding filter.
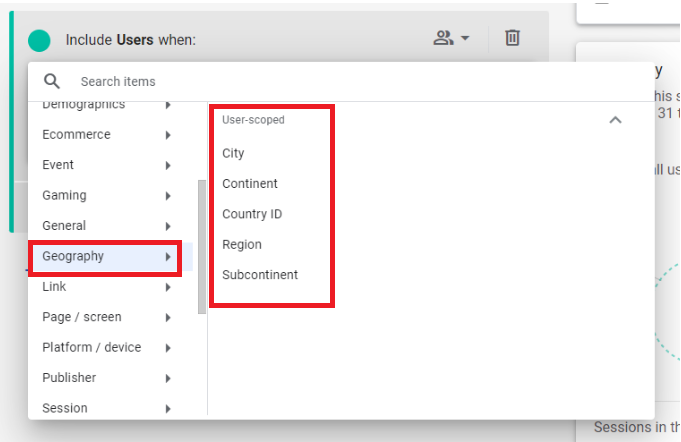
- For a geography-based user segment, click Geography and its corresponding filter.
-
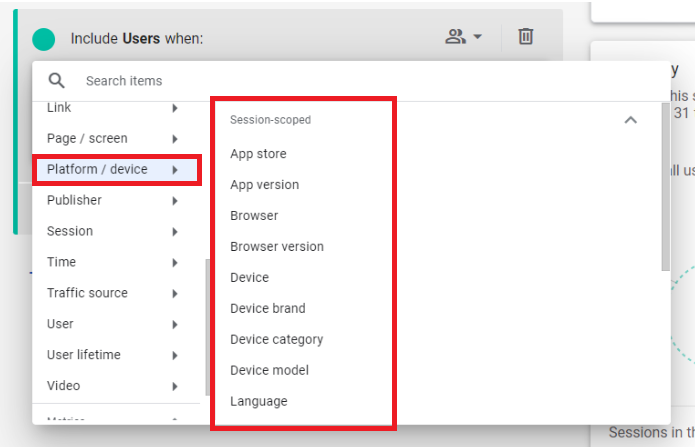
For a segment based on platforms or devices, click Platform/Device and its corresponding filter.
-
Segments in this example are based on geography. More specifically, they’re based on US and Non-US users.
-
Set the name of the first segment to US Users to denote users from the US.
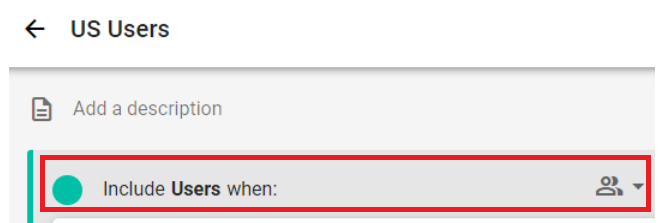
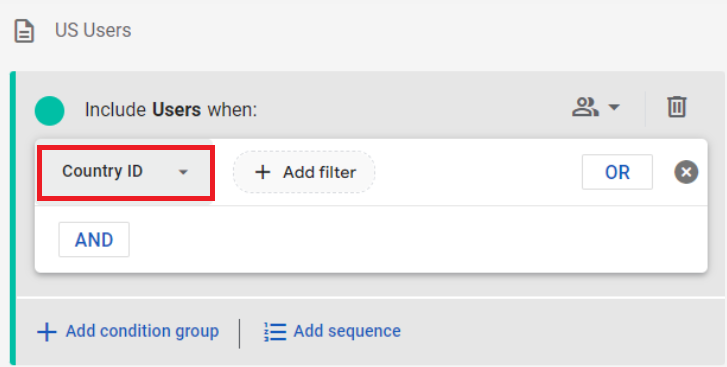
- Find the condition Country ID. Click on + Add filter.
- Set the Condition to exactly matches (=). The value should be set to US, then click Apply.
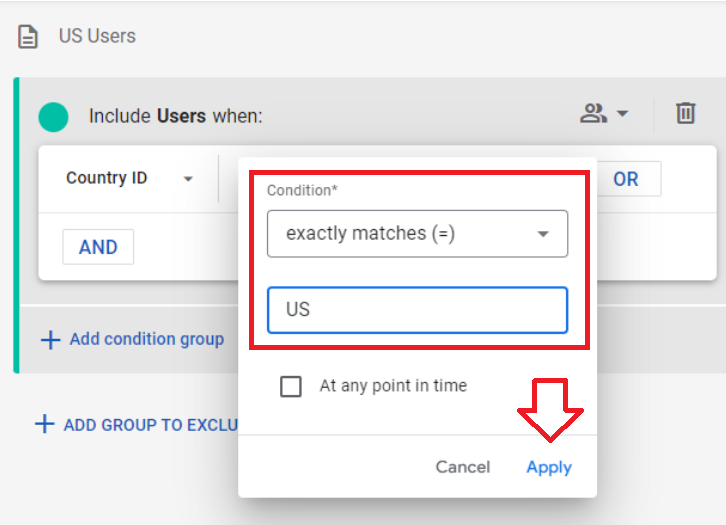
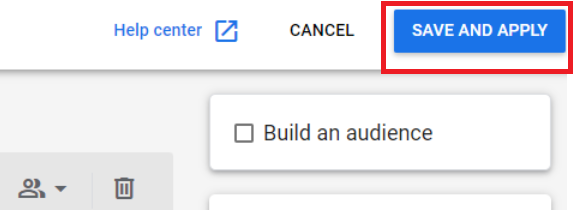
- This user segment will allow you to see how many US users are in this segment later on. Click SAVE AND APPLY. You will find this at the upper righthand corner of the page.
-
Let us now set up a different segment for users who are not from the US.
-
Click on User Segment and change its name to Non-US Users.
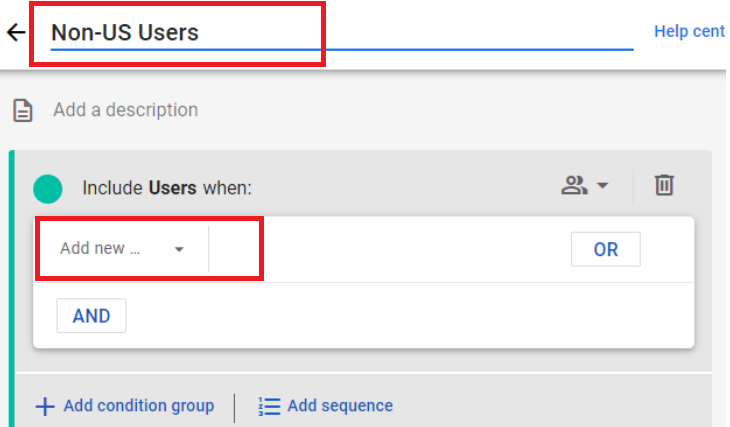
- Set the filter to does not exactly match (!=) for the condition Country ID. Set the value to US. Click Apply.
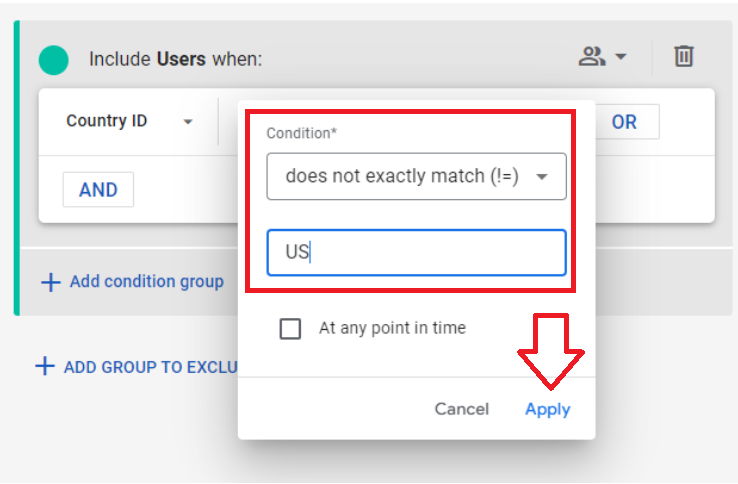
- Now you can see how many non-US users are in this segment. Click SAVE AND APPLY.
- You can now also see the user segments that the report has been applied with under Tab Settings.
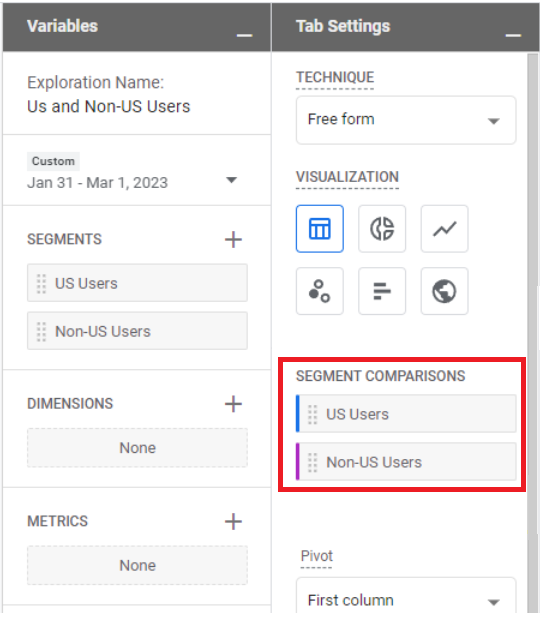
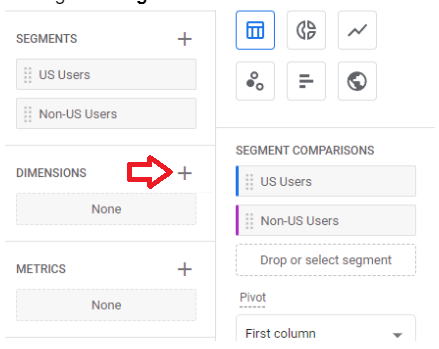
- We are now going to add dimensions to our user segments. You can do this by clicking the + sign beside Dimensions.
Remember: Dimensions affect how your data breaks down in your report.
For the purposes of this SOP, we are going to make a report that breaks down every individual product sold in-store.
-
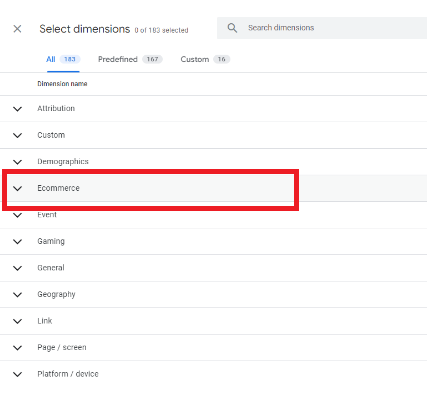
The Select dimensions panel will appear. Select Ecommerce, then Item Name.
-
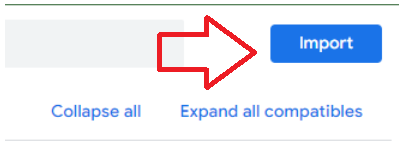
Then click on Import. It is located at the upper right hand corner of the panel. This will allow you to see the added product item name in the report.
-
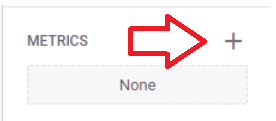
Next, click on the + sign beside Metrics. This will add another layer of data in understanding our user segments.
-
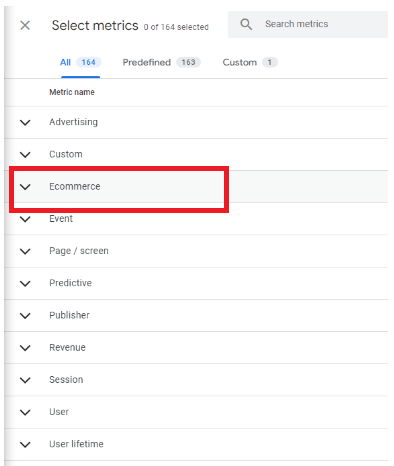
The Select metrics panel will appear. Again, select Ecommerce.
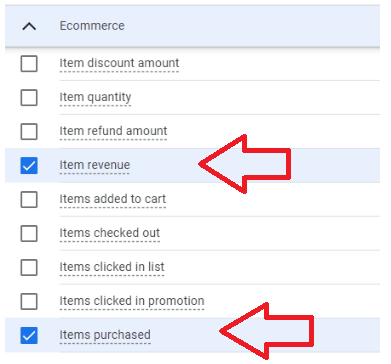
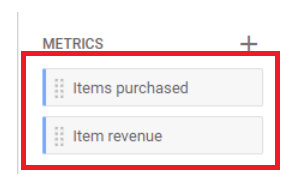
- Select Item purchases as well as Item revenue.
Remember: You can choose any metric you want included in the report. However, for the purposes of this SOP, we are going to examine all the item purchases made on your website or online shop along with the equivalent revenue.
-
From the top right corner, select Import.
-
The added metrics should now be visible in your report.
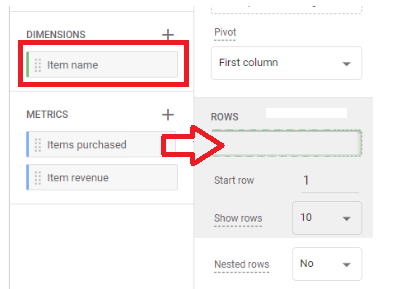
- Next, click on Item Name under Dimensions and drag it under Rows.
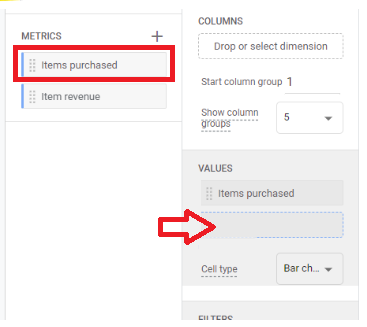
- Next, drag and drop the Items purchased and Item revenue metrics to the Value section.
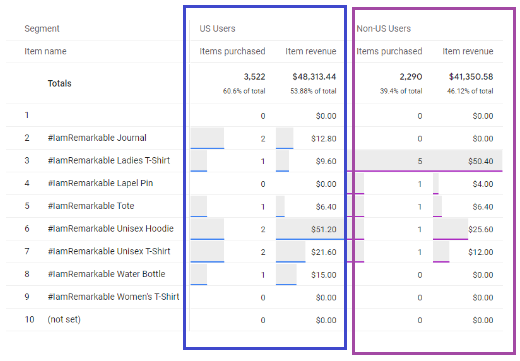
- The product sales and generated revenues should now be visible to you after they’ve been segregated into US and Non-US customers. You can check other user segment types to experiment with the metrics you want to see on each report.
Conclusion
You’re done! Remember, creating and analyzing user segment reports will uncover crucial data about the identity of your website or online shop’s visitors. Learn who they are, where they are located, the items that they prefer, and more.
This way, you will be able to adjust your marketing and sales strategies to further boost conversion and sales.
-
Creating a user segment report will help you track a particular target demographic and how they interact with your website or online shop.
-
To do this, you should first set up a Google Analytics account.
-
Then, set the user segments, dimensions, and metrics that you want to see in your website’s reports.
-
Next, drag your dimensions under Rows. Then, drag your metrics under Values.
-
This will reveal the data you wish to analyze.
-
Feel free to experiment with other segments, dimensions, and metrics to further reveal valuable data about your website or online shop’s users.