A Guide to Analyzing Subdomain Reports in Google Analytics for Deeper Insights
To learn to manipulate the subdomain report
Prefer a shortcut? 16 free tools do parts of this for you.

Aim: To learn to manipulate the subdomain report
Optimal Outcome: For the decision-makers to make business decisions based on facts and data.
What you need to start: You must correctly set up your Google Analytics 4 to generate the correct Pages and Screens report.
Why is this SOP Important: The page and screen views are significant in your data analysis because you want to gain insight into what your website visitors want. For example, if some blog posts attract thousands of views, you know that these pages rank well with organic search. On the other hand, you should optimize poor-ranking blog posts with more keywords and additional information to make them longer.
When to execute: You can run the report regularly, preferably monthly, to understand customer behaviors.
Who Should Be Doing This: A person in the marketing team
What Is Google Analytics’ Subdomain Report?
Google Analytics 4 automatically handles subdomains; thus, you don’t need to set them up. You can access the report through the Pages and Screens under the Engagement submenu in Reports. According to page views, you can see a breakdown of your website or app performance. This report shows what your visitors view when they visit your website or mobile app. Monitoring consumer behaviors is essential in data analysis because you want to know what interests your users. Moreover, you can use the insights you gain from the report to make the right business decisions.
Execution
Resources/Tools & Set up
- Google Analytics account
Step 1: Access the Pages and Screens Report
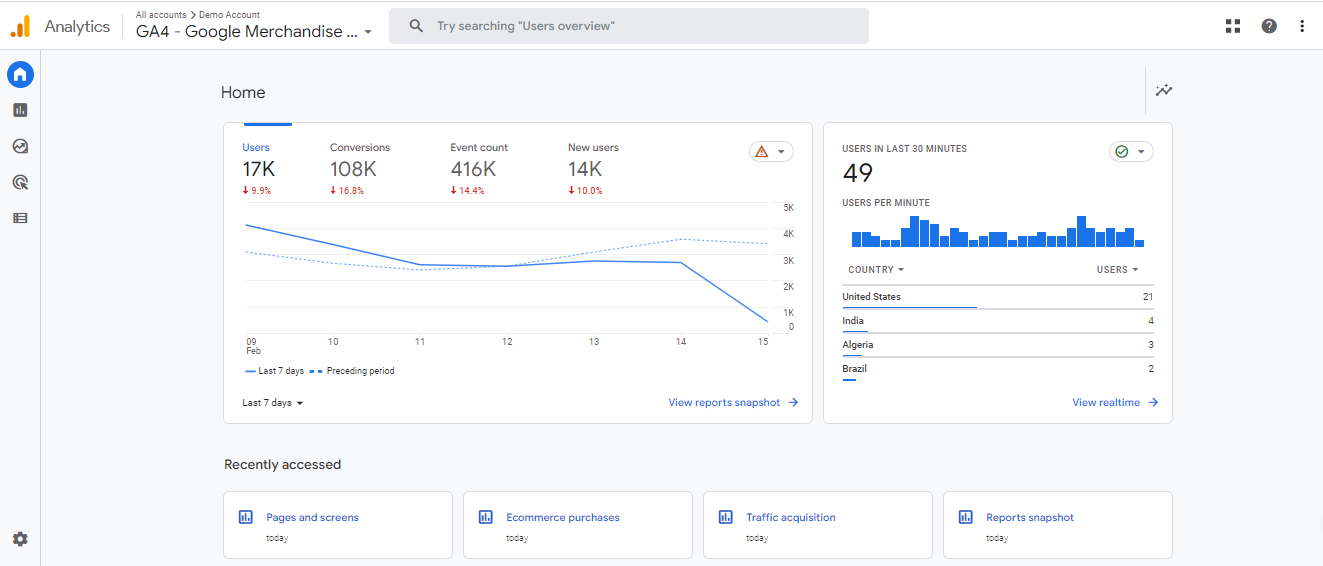
- Log in to Google Analytics using your Google account. You’ll see the dashboard.
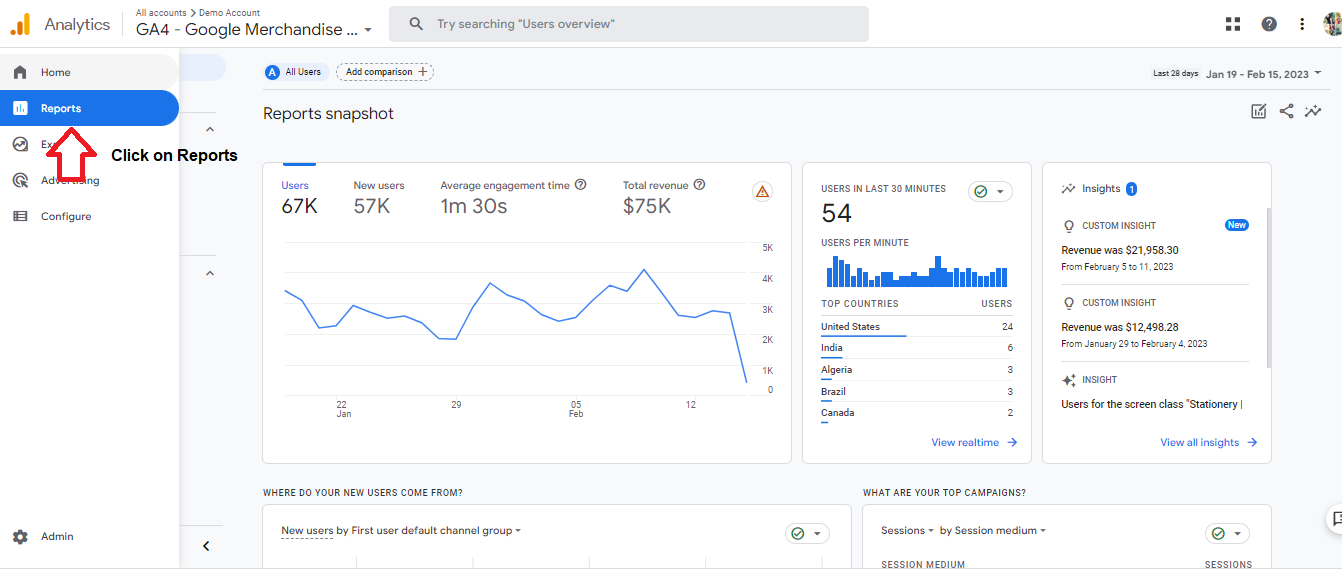
- Access the Reports menu by clicking on the icon below the Home icon.
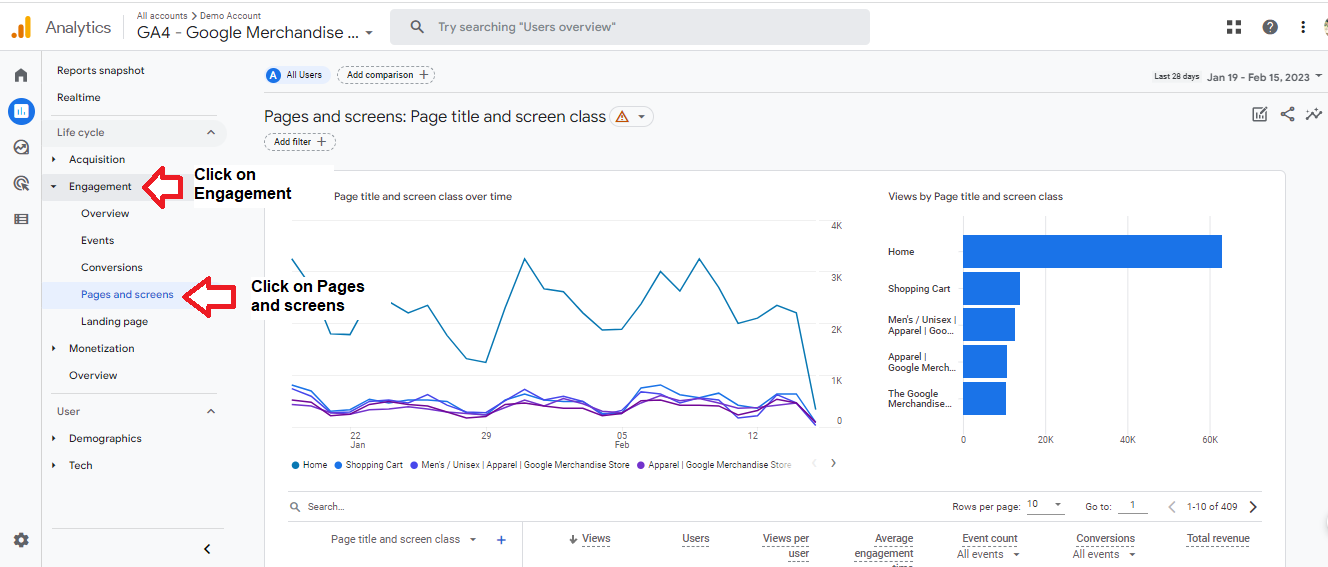
- Click on Engagement under Reports, then Pages and screens. If you set up your Google Analytics correctly, you don’t have to worry about subdomains. Google Analytics 4 can automatically handle your subdomains.
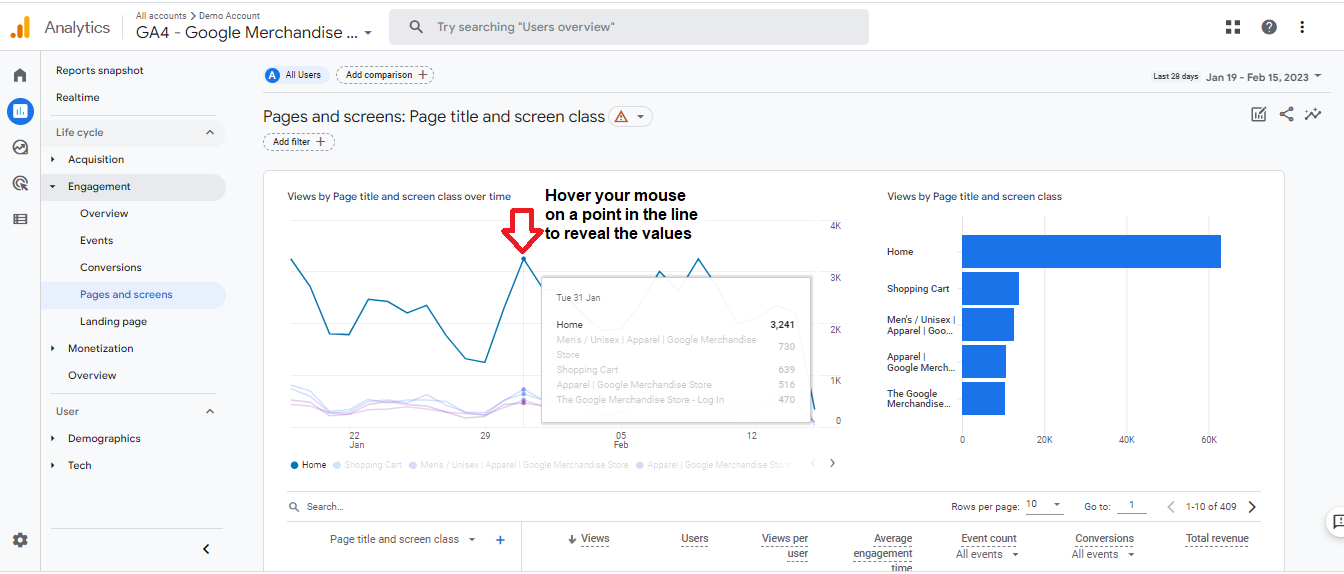
The first half of the screen shows two graphs - a line graph and a bar graph.
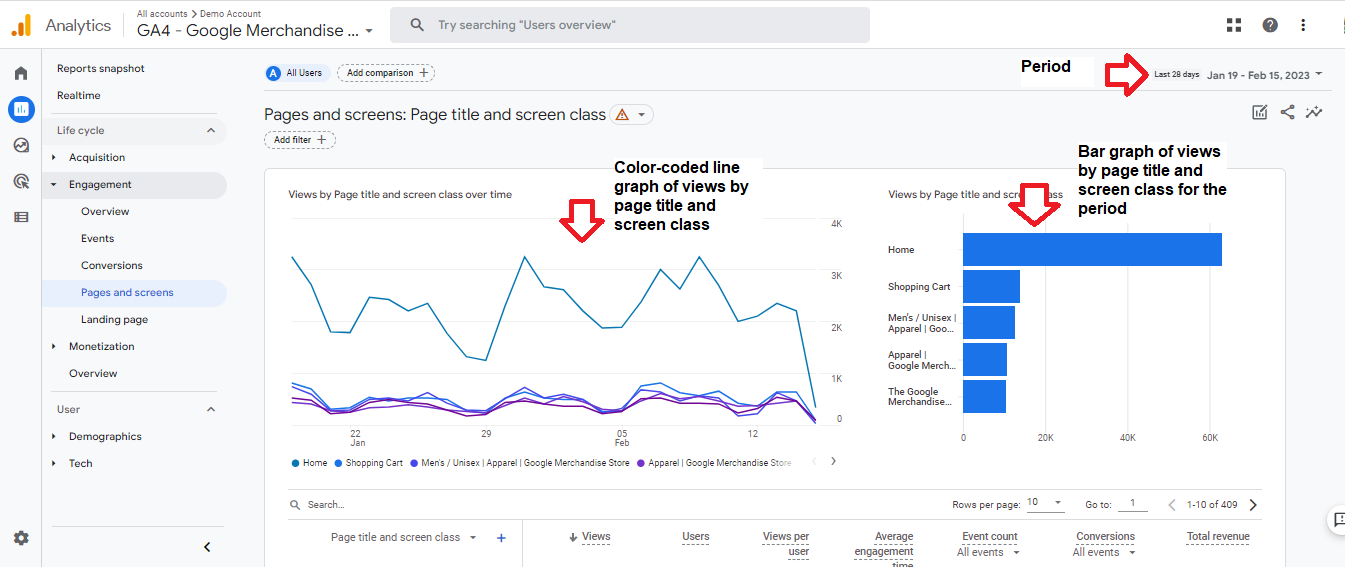
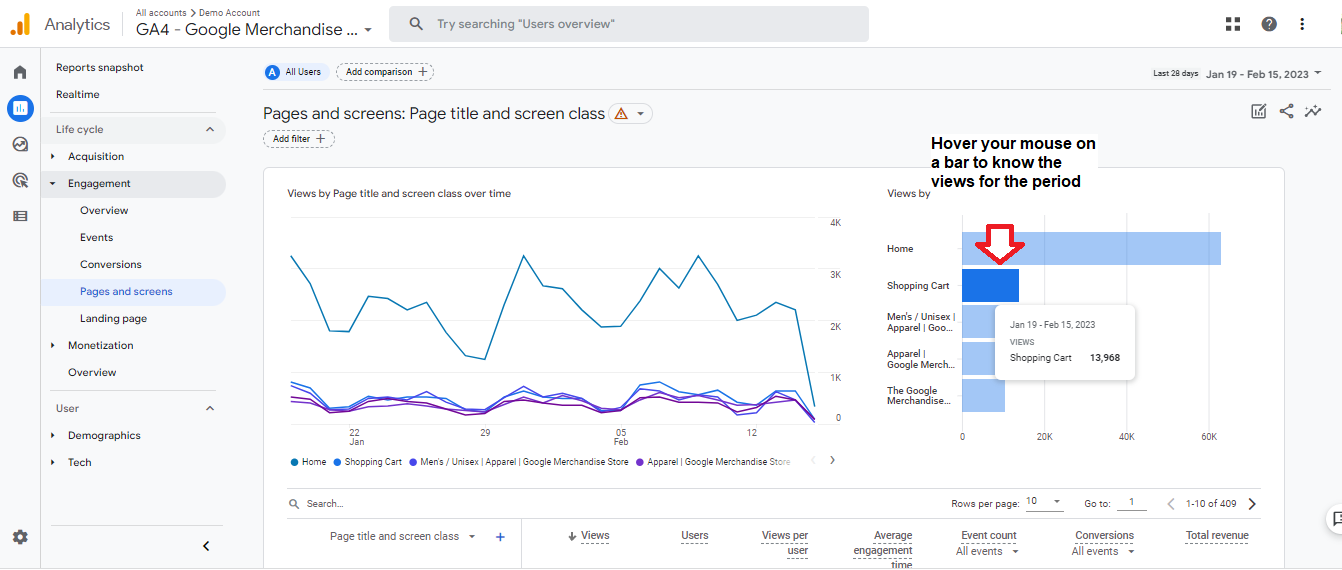
If you want to know the actual values, hover the mouse on the line or bar.
Please hover your mouse on a bar to know its value.
Scroll down to reveal the details.
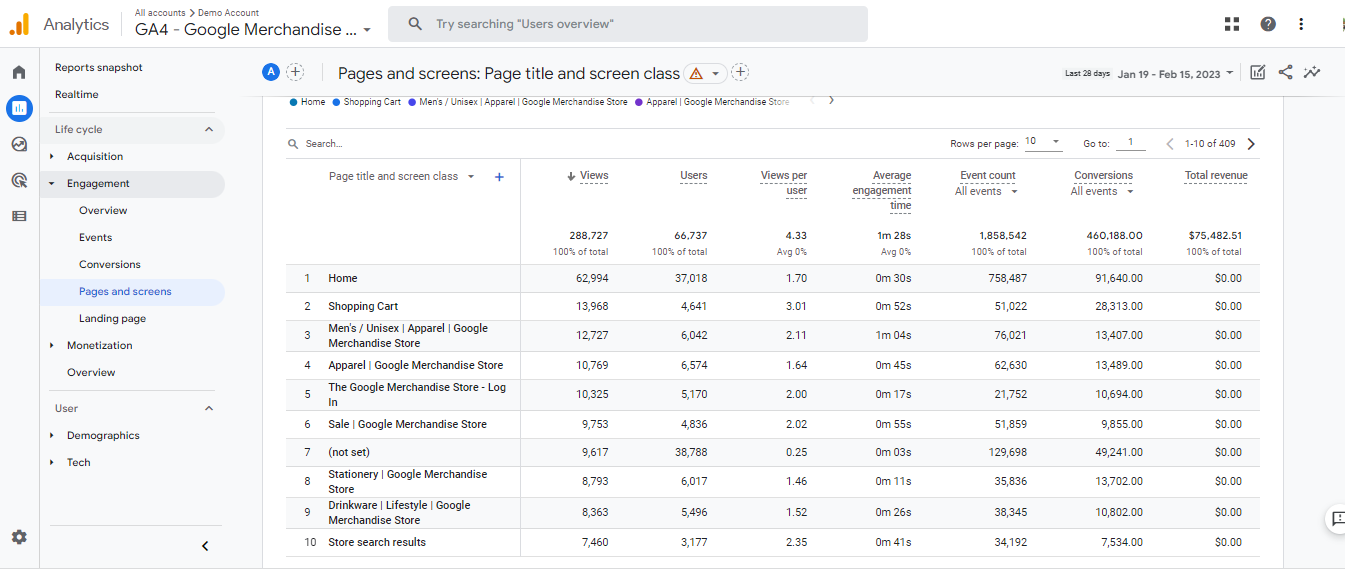
Step 2: Customize the report.
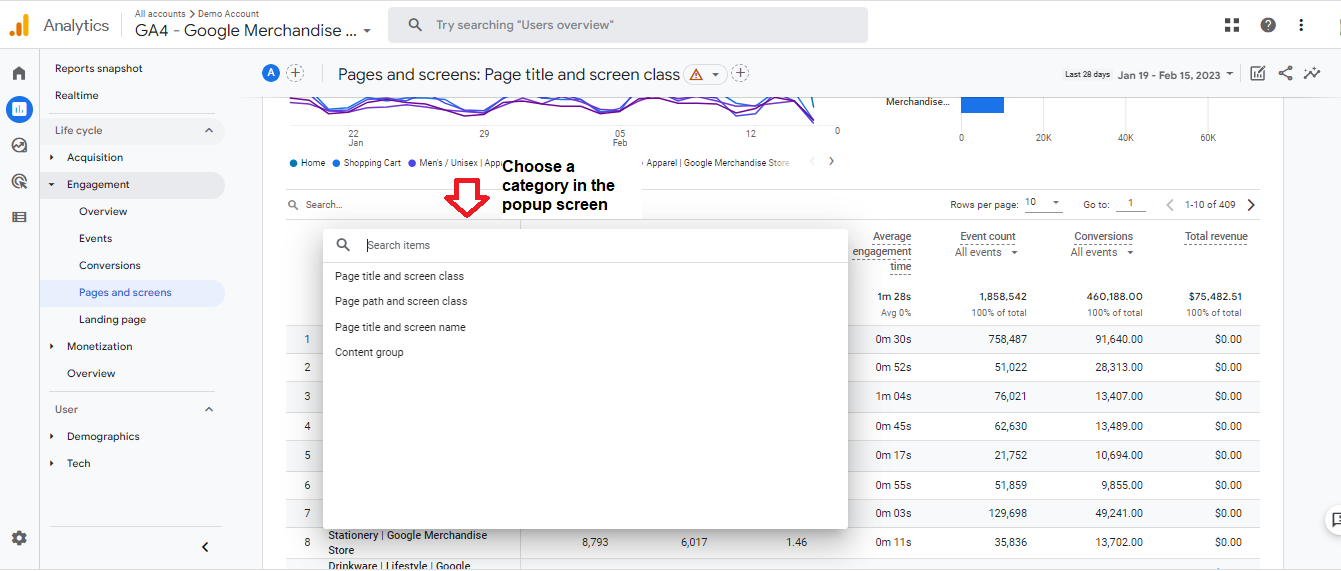
- Change the category.
If you wish to change the categories, you may hover your mouse on the first column and click the down arrow.
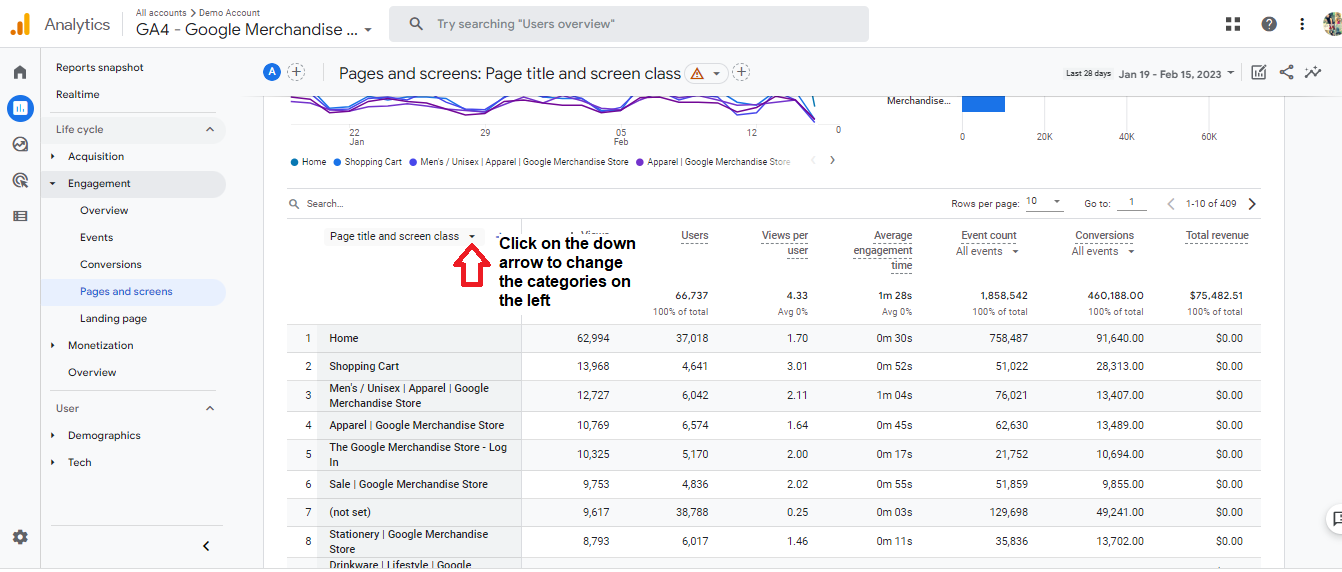
Choose a category.
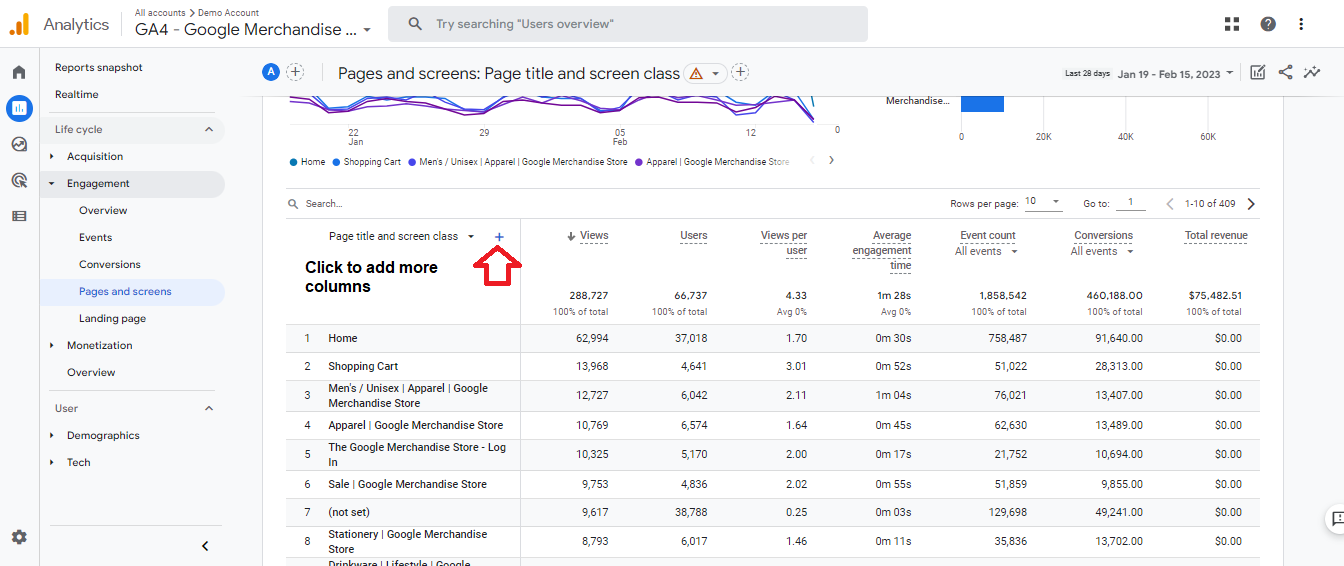
- Add a column.
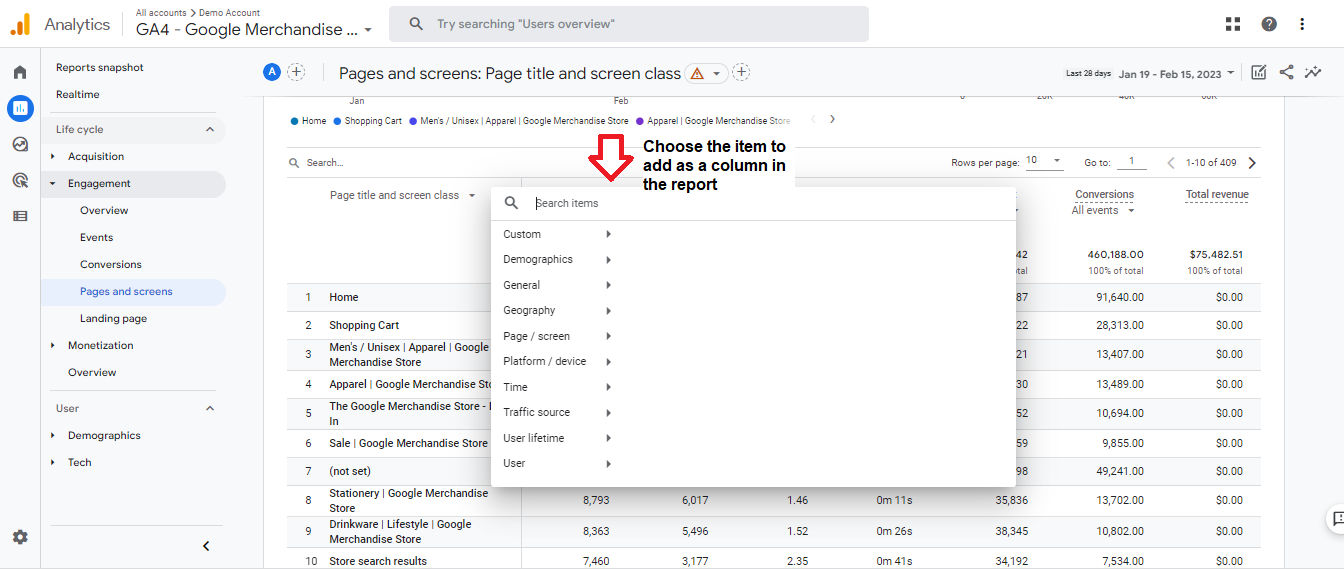
Pick an item to add as a column in the report.
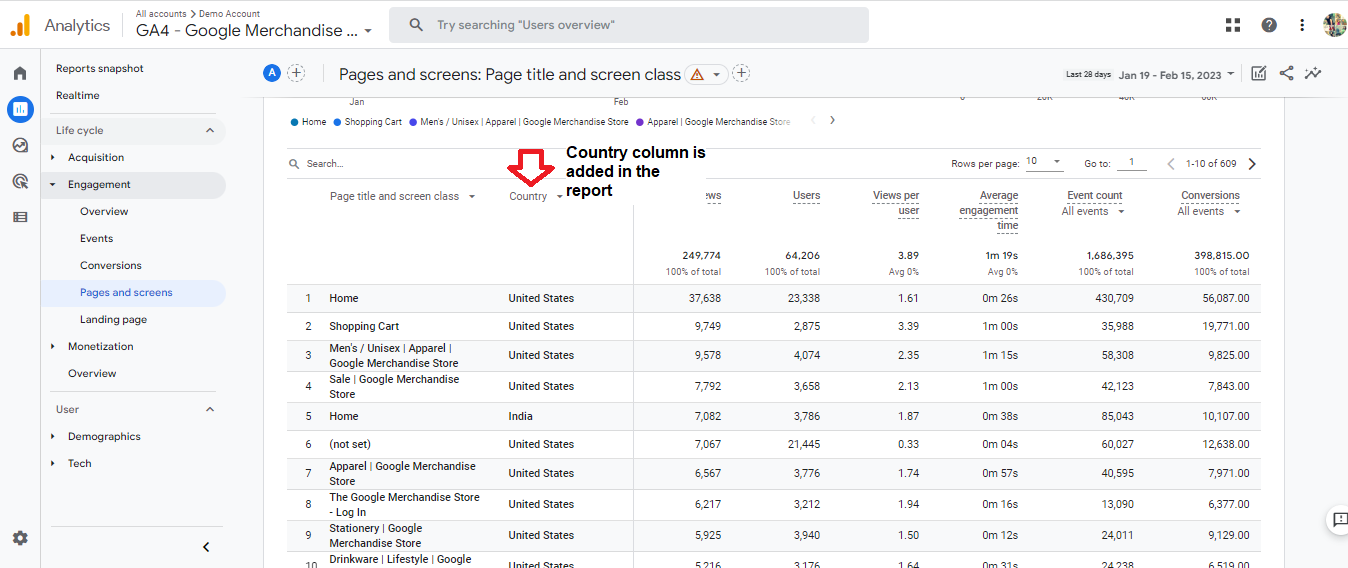
For example, you want to add a country as a column to determine how many guests visit a page from a specific country.
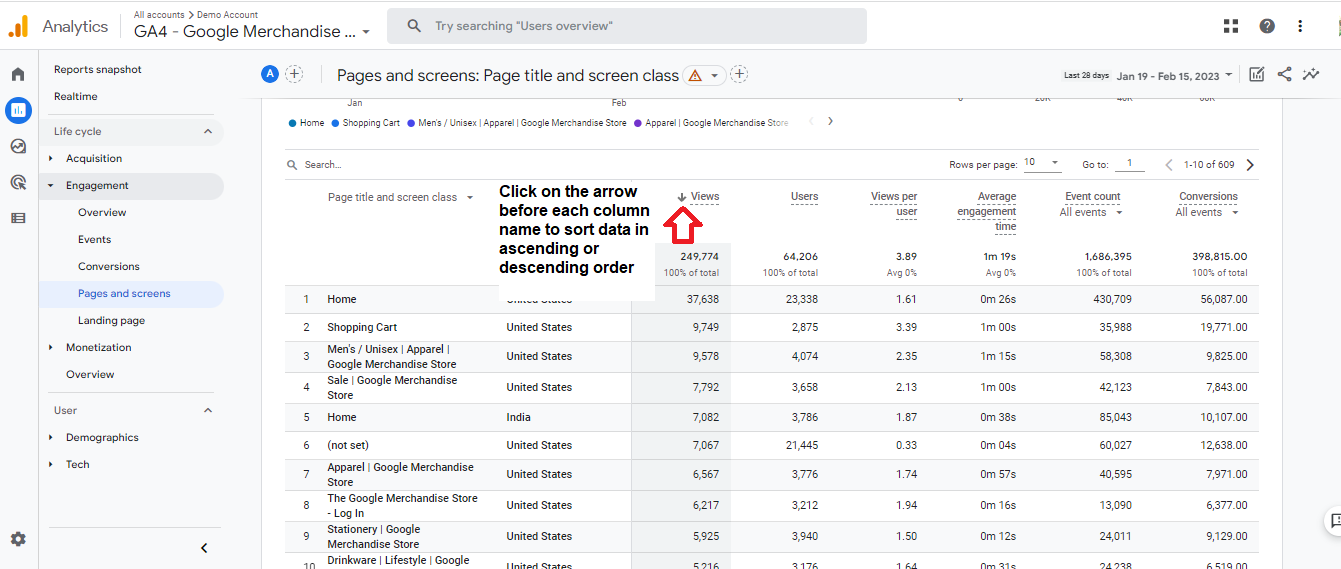
- Sort the data in a column in ascending or descending order.
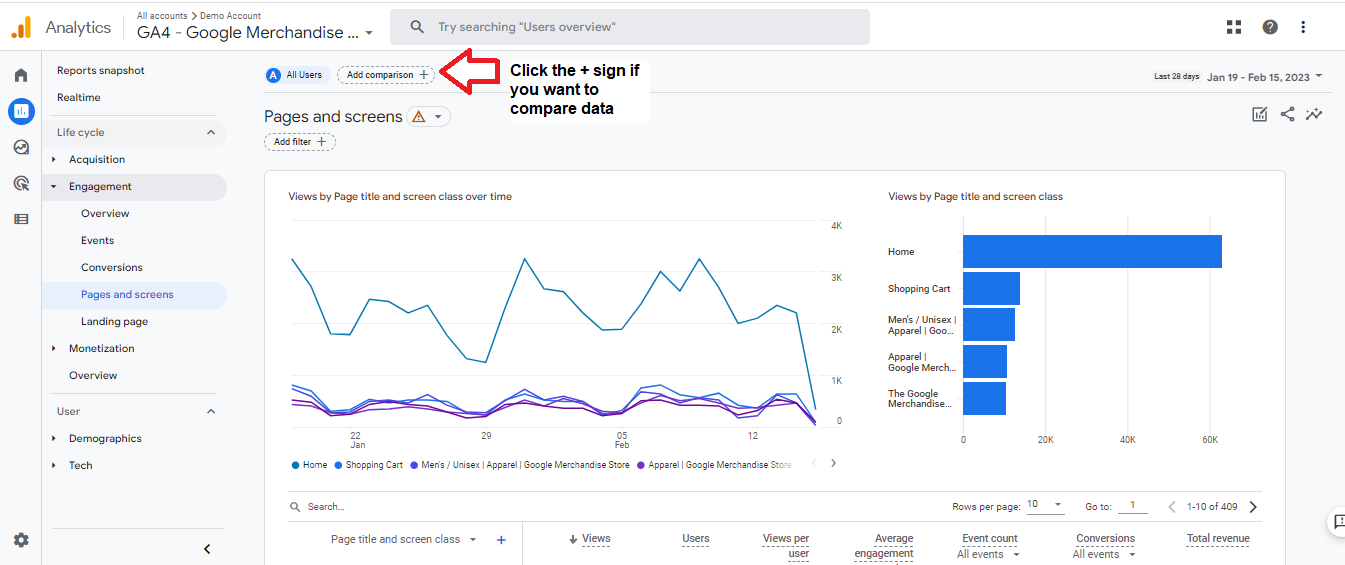
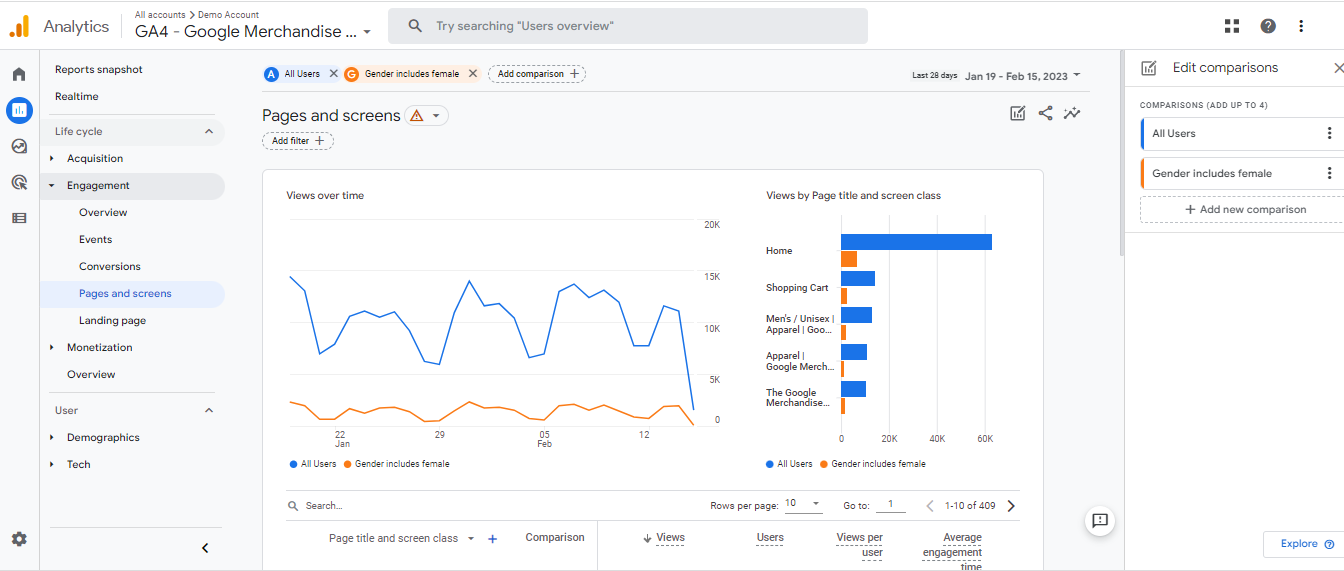
- Setup comparisons. You can compare the overall views with a specific parameter by clicking on the + beside Add comparison.
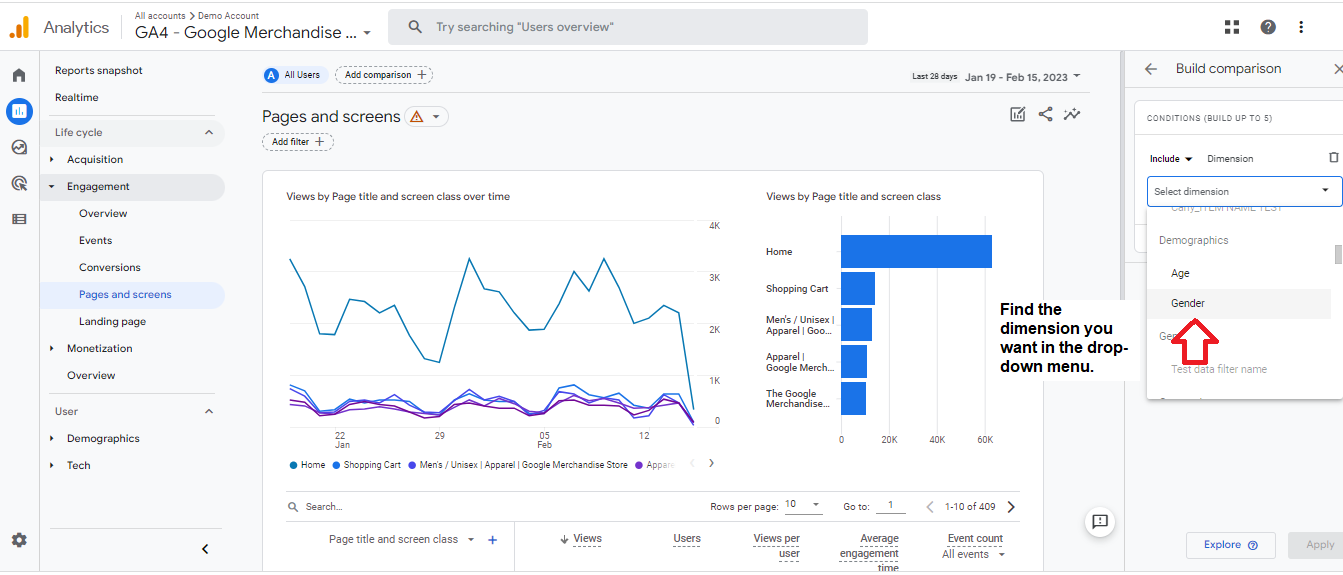
For example, you want to compare the views from female visitors with the total page views. Then, you can search for the Gender parameter in the screen's box on the right side.
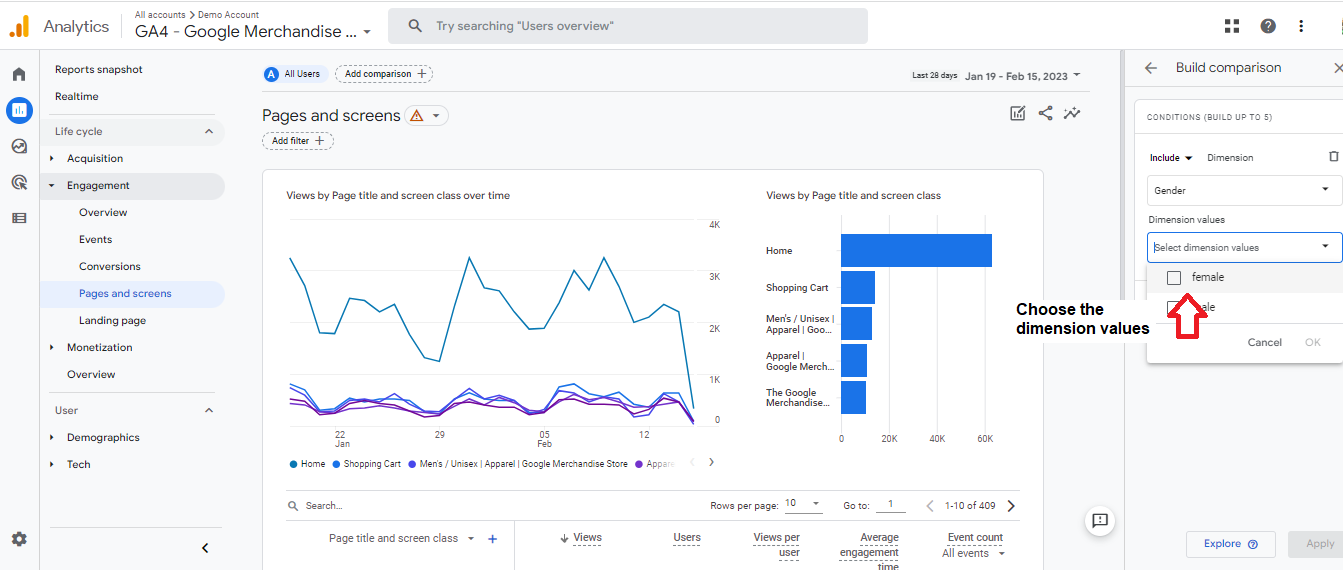
Choose the dimension value, then click ok. Click Apply.
The report will then show the total and female views (in orange).
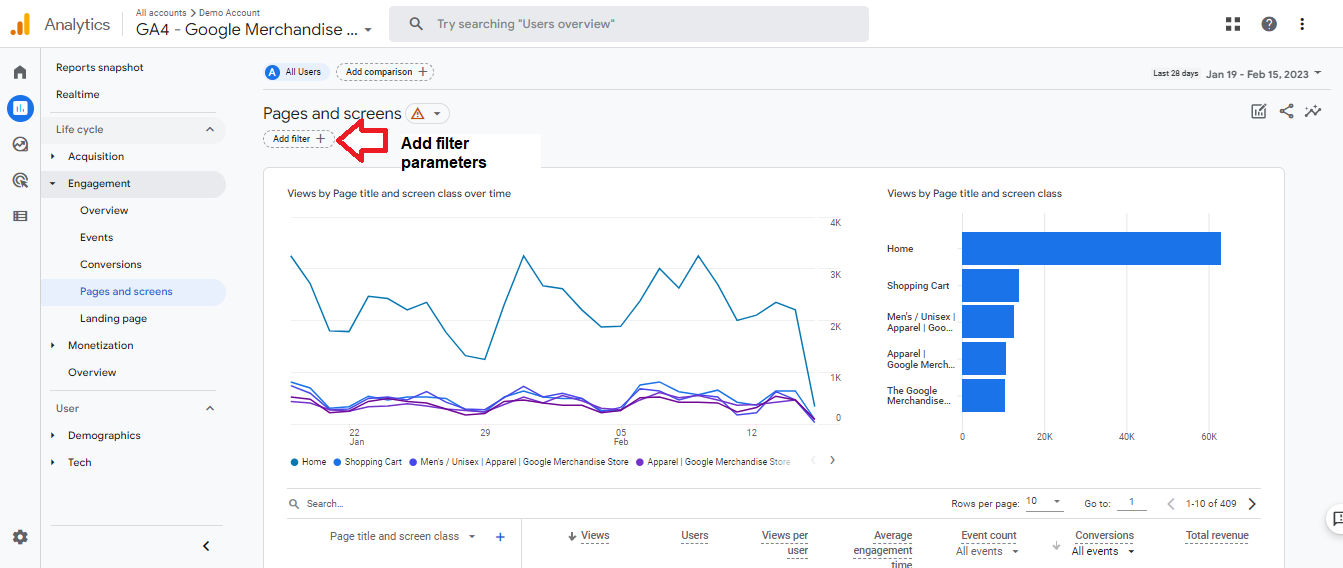
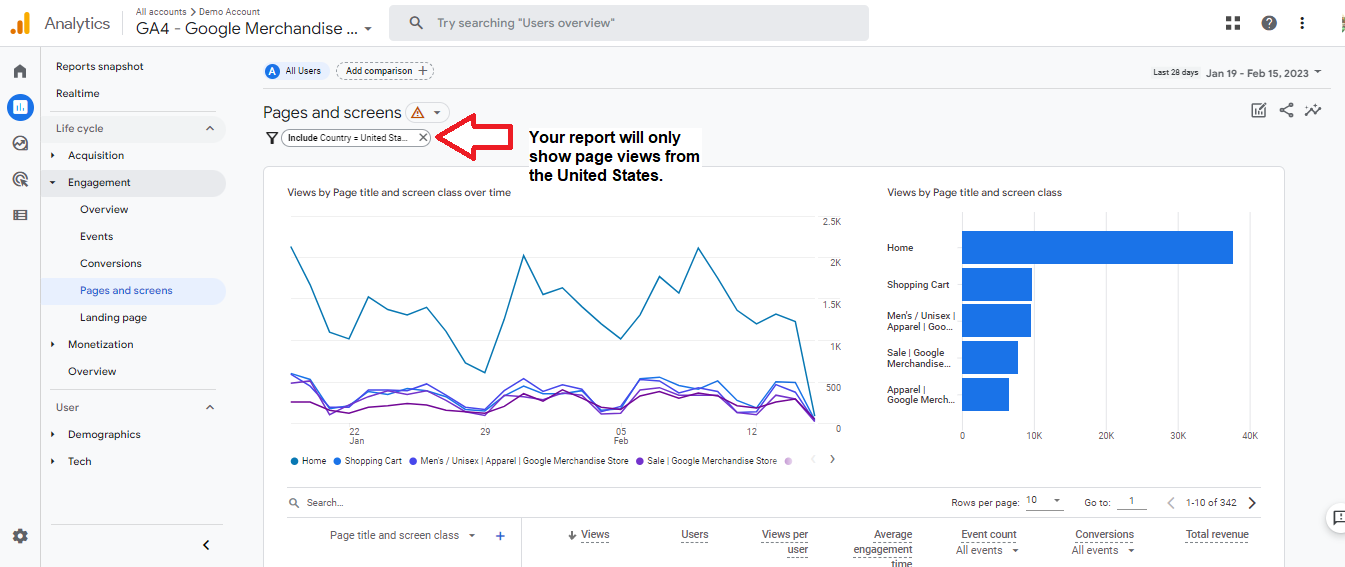
- Add filter parameters. Click on the + beside the add filter.
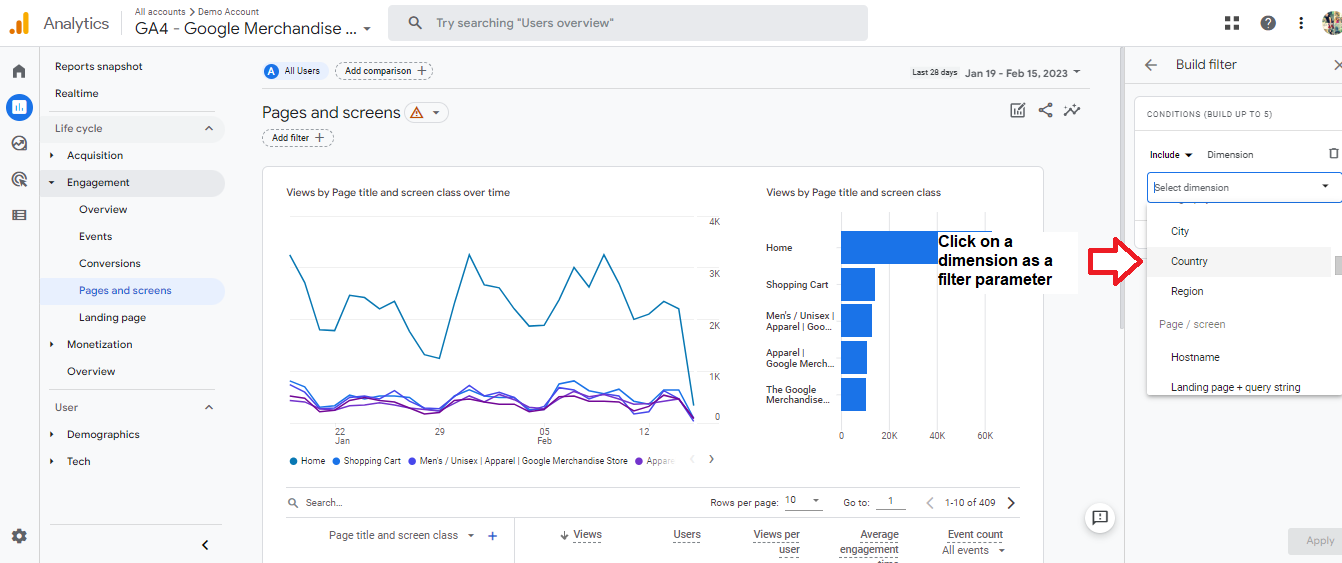
For example, you only want to show the page views for a specific country - the United States. Search for Country in the dimension on the right side of the screen.
Choose the United States as the dimension value.
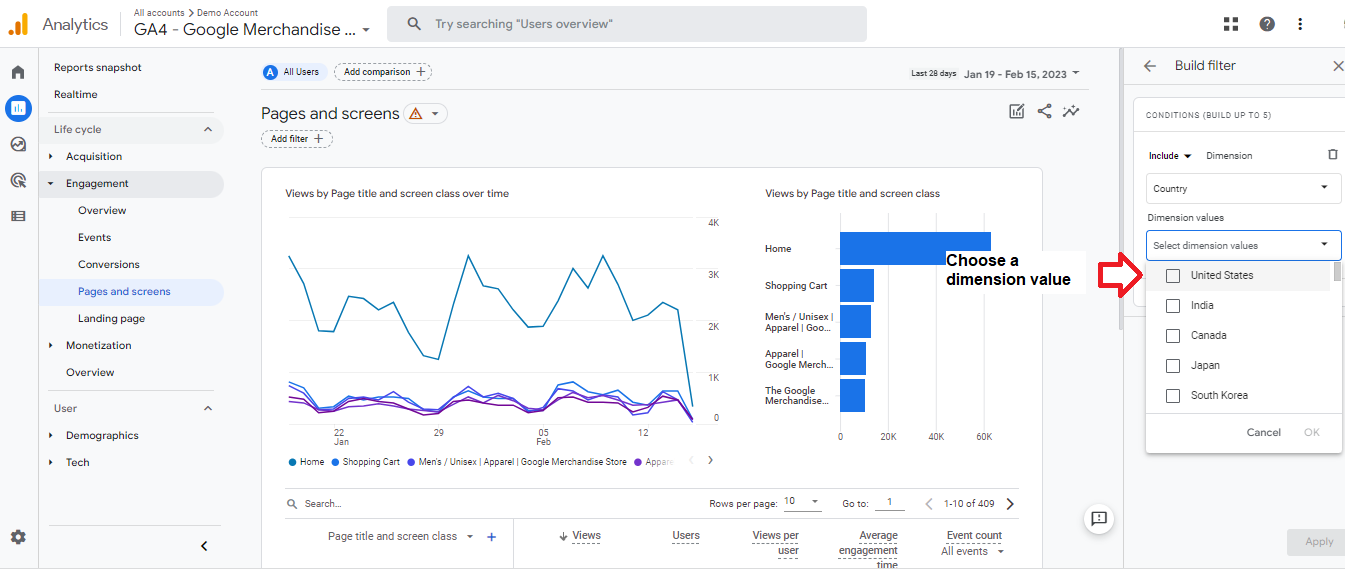
Your report will only show views from the United States.
Conclusion
Congratulations! You now know how to manipulate the report to the information you want to make data-driven business decisions.
Execution Checklist:
-
Understand consumer behaviors using your website or app through Google Analytics.
-
If your website has subdomains, you don’t have to set them up in Google Analytics 4.
-
Access the Page and Screen Views under the Engagement submenu in Reports.
-
Use the filters and comparisons to understand consumer behaviors better. Add columns and sort data to find more information about subdomain views.
-
Make data-based, accurate business decisions using Google Analytics.