Adding Annotations to Google Analytics to EnhanceYour Analysis with Contextual Information
To give you a step by step guide in adding annotations to your Google Analytics view.
Prefer a shortcut? 16 free tools do parts of this for you.

Aim: To give you a step by step guide in adding annotations to your Google Analytics view.
Optimal Outcome: An annotation is logged into Google Analytics and accessible to other Google Analytics’ users.
What do you need to start: Google Analytics account
Why is this SOP Important: Annotations in Google Analytics provide contextual information, collaboration opportunities, historical insights, improved data analysis, and better reporting. They help users understand their data and make more informed decisions.
When and Where to execute: It is advisable to create annotations for any changes that may impact your data. Any factors that have caused a surge or drop in traffic should be added as an annotation as they are typically essential. You can do this in the Google Analytics tool.
Who Should Be Doing This: Data Analyst
What is Google Analytics Annotation?
Google Analytics Annotations is a feature that allows users to add notes to specific dates on their Google Analytics timeline, providing contextual information about events, campaigns, or changes in their website or business. This feature can help users understand the reasons behind changes in metrics, collaborate with team members, gain historical insights, and make more informed decisions.
Execution
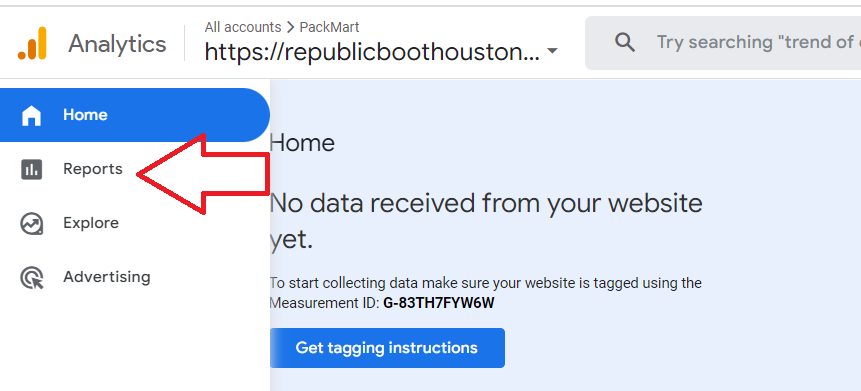
- Login to Google Analytics, and click Reports.
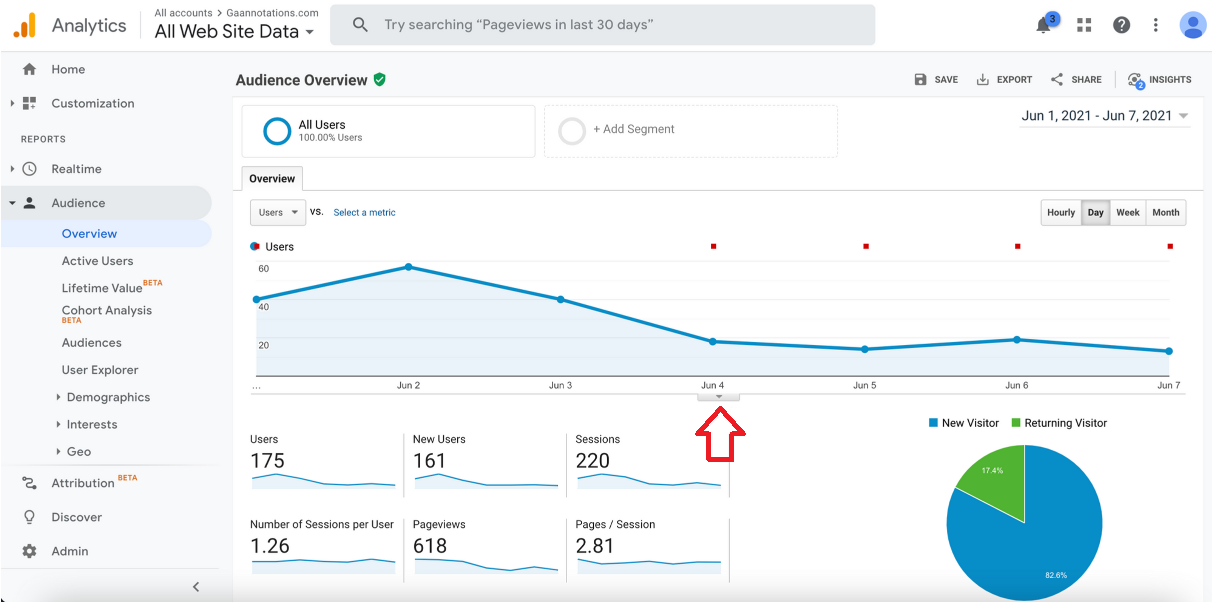
- Click the arrow just below the graph.
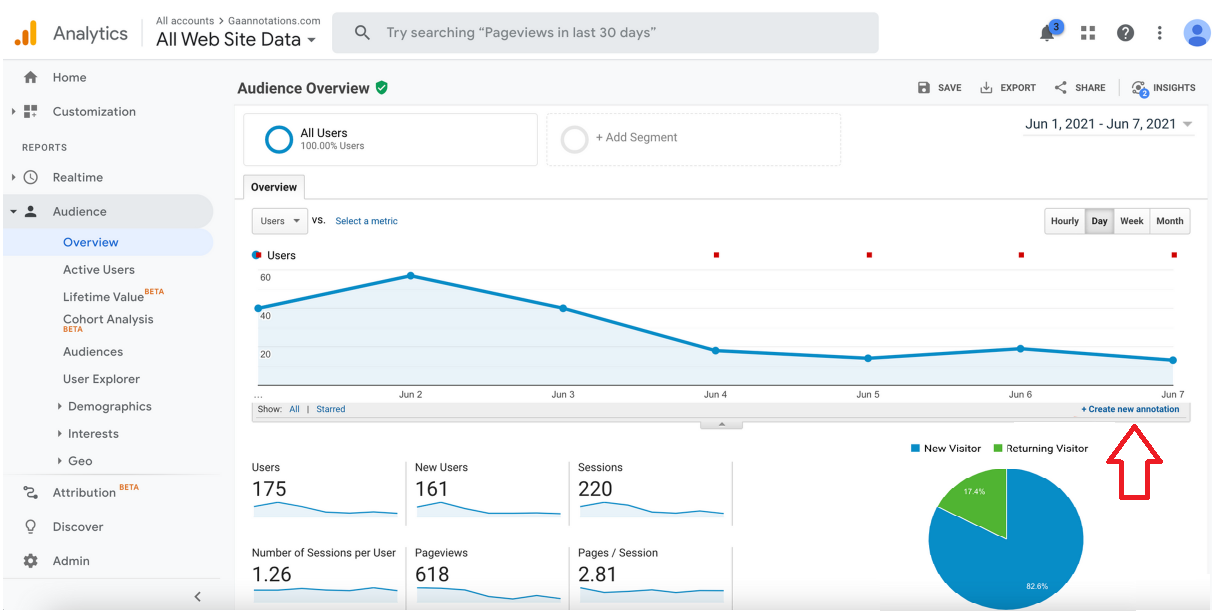
- Click Create new annotation.
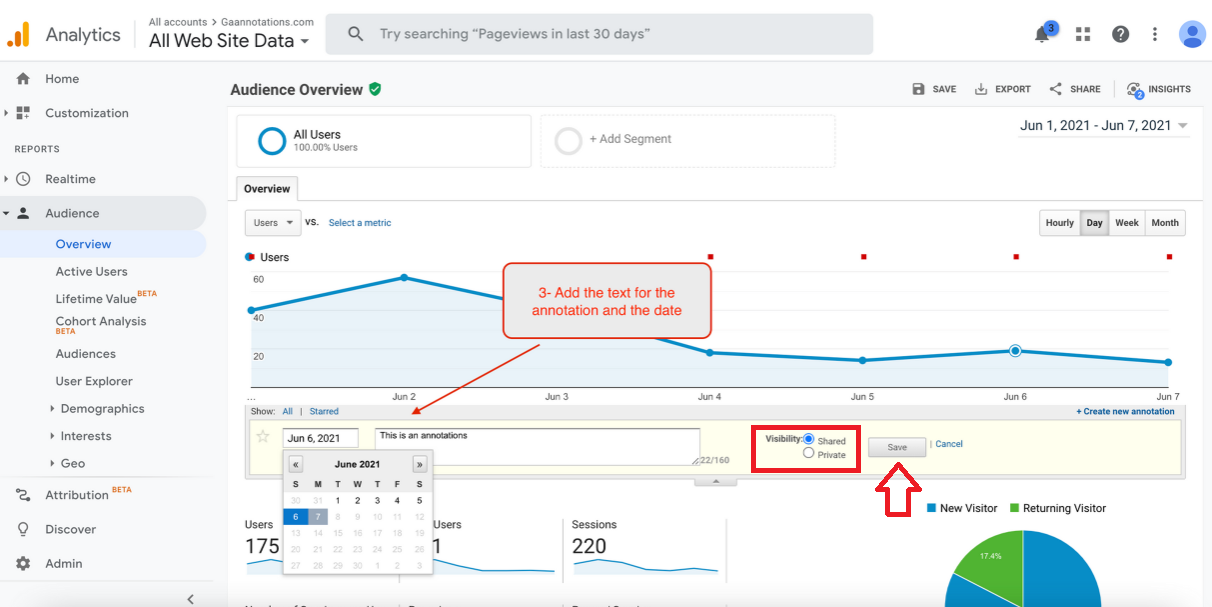
- Type your text for the annotation then choose the date when this annotation will appear. You can choose whether this annotation is just for you or shared to other users of the report. Click Save.
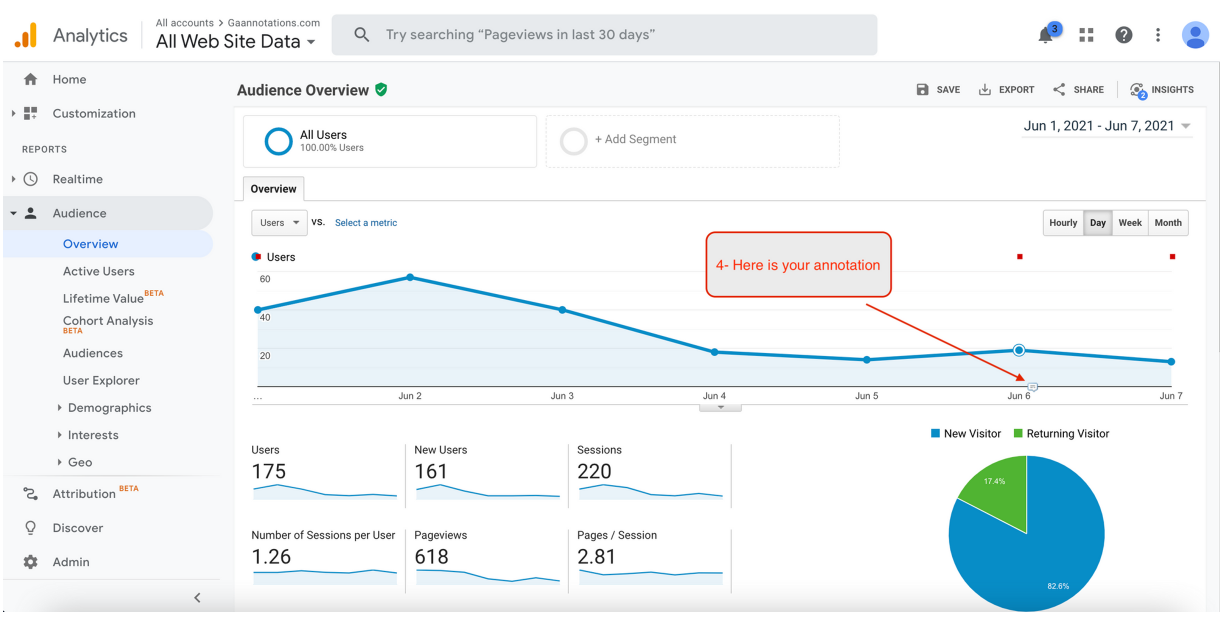
- On the graph, you can find the annotation on the date that you selected during creation.
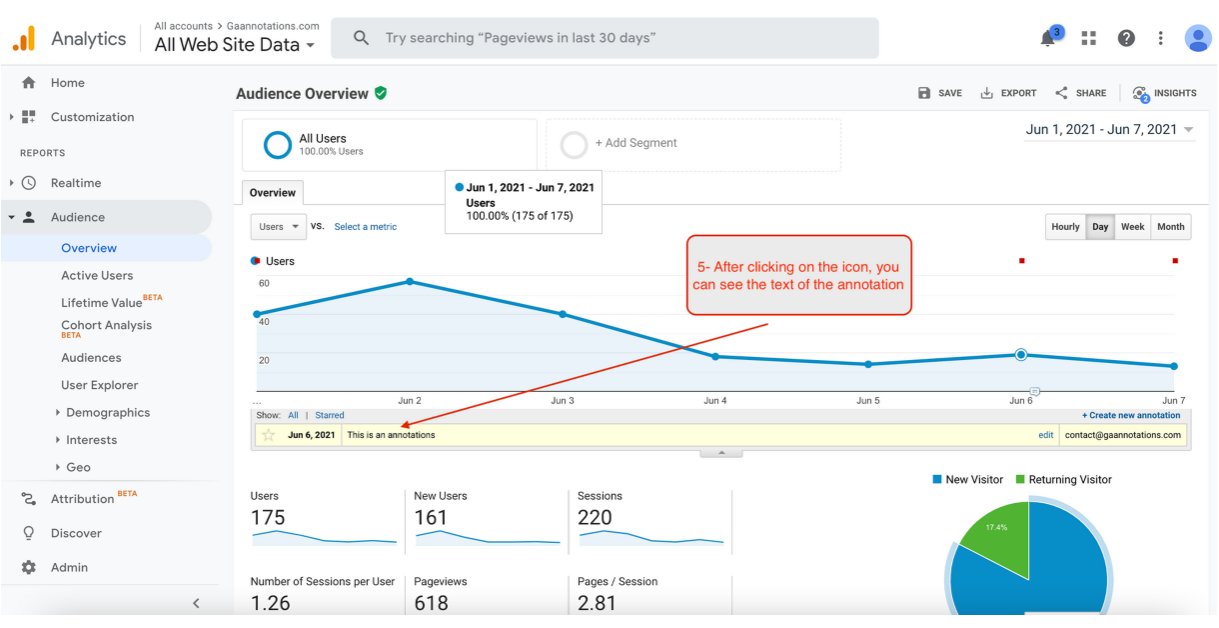
- If you click the annotation, you’ll be able to read the text just below the graph.
Conclusion
That’s it! You can now add more annotations to your Google Analytics reports to provide context and enhance your data analysis.
Best practices in adding annotations
-
Annotations should be written in a way that is easy to understand and provide clear information. Use short sentences or bullet points to convey your message.
-
Use the same format and language for all your annotations to ensure that they are easily recognizable and understood.
-
Annotations can provide context for spikes or dips in traffic or conversions. For example, you may annotate a particular day as the start of a new marketing campaign, which could explain a spike in traffic.
-
Include relevant details in your annotations, such as date, time, and reason for the annotation. This will make it easier to understand the context and significance of the event.
-
Encourage your team members to add their own annotations to provide additional context and insights.
-
Avoid too many annotations, as this can clutter your data and make it more difficult to interpret.
-
Make a habit of adding annotations regularly, and try to be consistent in terms of when and how often you add them. This will make it easier to identify patterns and trends in your data.