A Guide to Setting Up and Creating Interactive Reports and Dashboards with Google Data Studio
To create impressive and interactive reports and dashboards n Google Data Studio.
Prefer a shortcut? 16 free tools do parts of this for you.

Aim: To create impressive and interactive reports and dashboards n Google Data Studio.
Optimal Outcome: You will have personalized, professional, and interactive dashboards and reports on Google Data Studio. Doing so will allow you to access useful, actionable, and easy-to-understand data.
What do you need to start: You will need an active Google account.
Why is this SOP Important: Creating reports, especially from multiple sources, can be tedious and time-consuming. To make matters worse, the presentation of these reports is not always easy to understand. This SOP will help in creating professional reports on Google Data Studio that can present the most crucial data at a glance, thus increasing productivity and analytics efficiency.
When and Where to execute: This SOP will be performed in Google Data Studio. You may follow this every time you want to create reports and visualize your data.
Who Should Be Doing This: The person handling analytics
What is Google Data Studio?
Also known as Looker Studio, Google Data Studio is an online platform that allows users to visualize data and create analytics reports. It also seeks to help users build personalized dashboards to further boost productivity, analytics efficiency, and collaboration, among many other benefits.
What sets Google Data Studio apart from other analytics tools is its combination of multiple features. Indeed, there are other analytics platforms out there that can use multiple references to create a single report. Others may also offer simple and automated reporting capabilities. Some may even offer such services for free. However, you will find it hard to find a single platform that provides them all. And this is the real charm of Google Data Studio.
Execution
Resources/Tools & Set up
- An active Google account to access Google Data Studio
Selecting the Right Template
-
Log into Looker Studio.
-
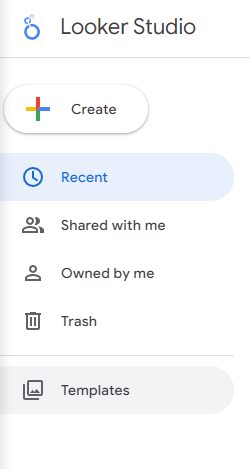
Select the template you want to use by clicking on Templates under the main menu at the lefthand panel of the dashboard.
- This will open the Template Gallery.
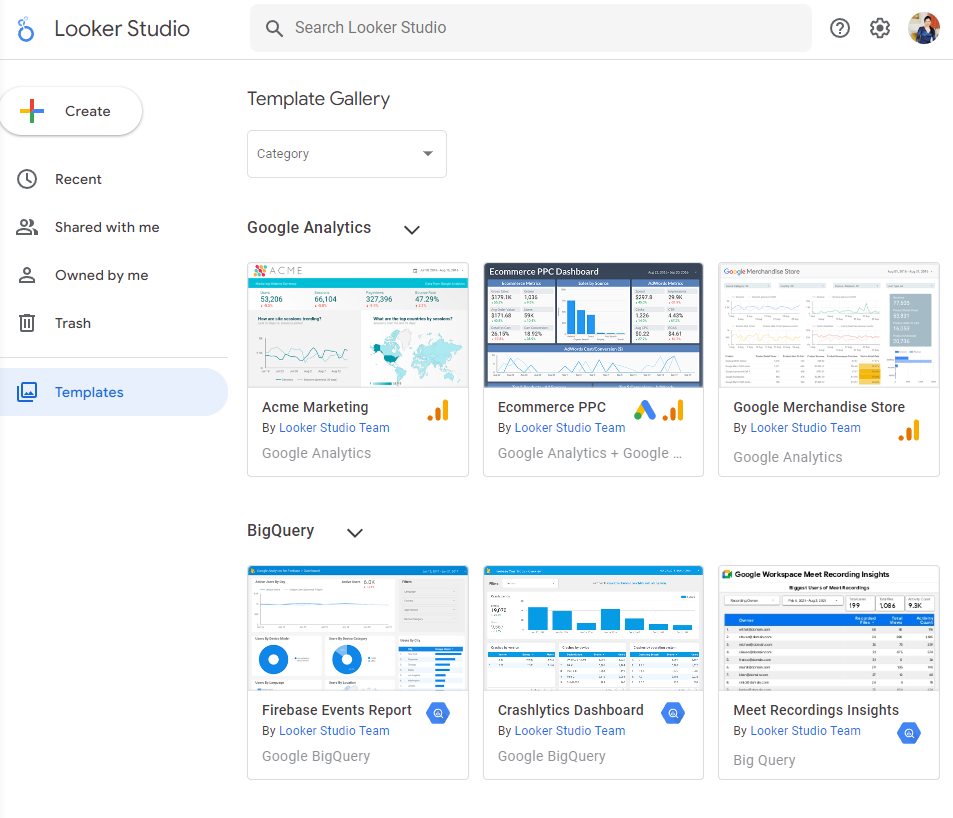
- You have the option to explore a certain category by clicking on the Category dropdown menu. This will reveal the different options you have.
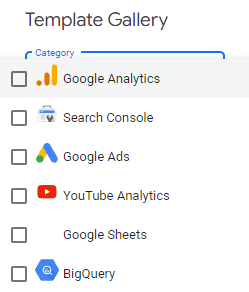
Tick on the appropriate category. For the purposes of this SOP, let’s say that we need a Google Analytics template.
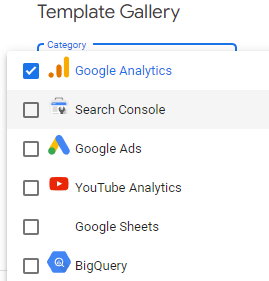
This will leave you with the available options.
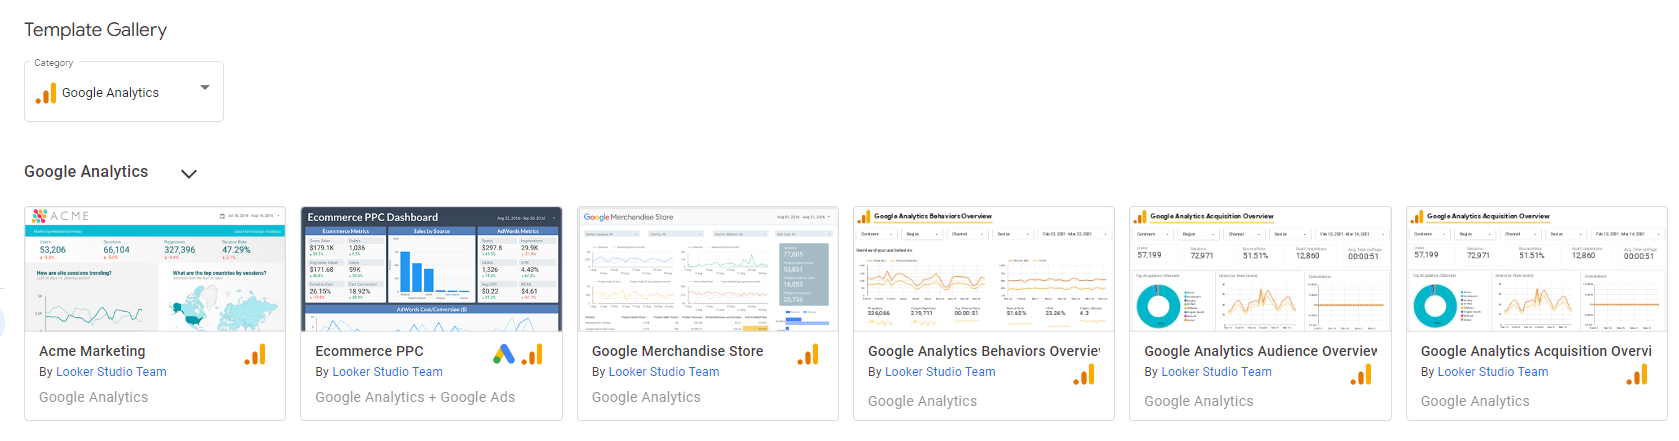
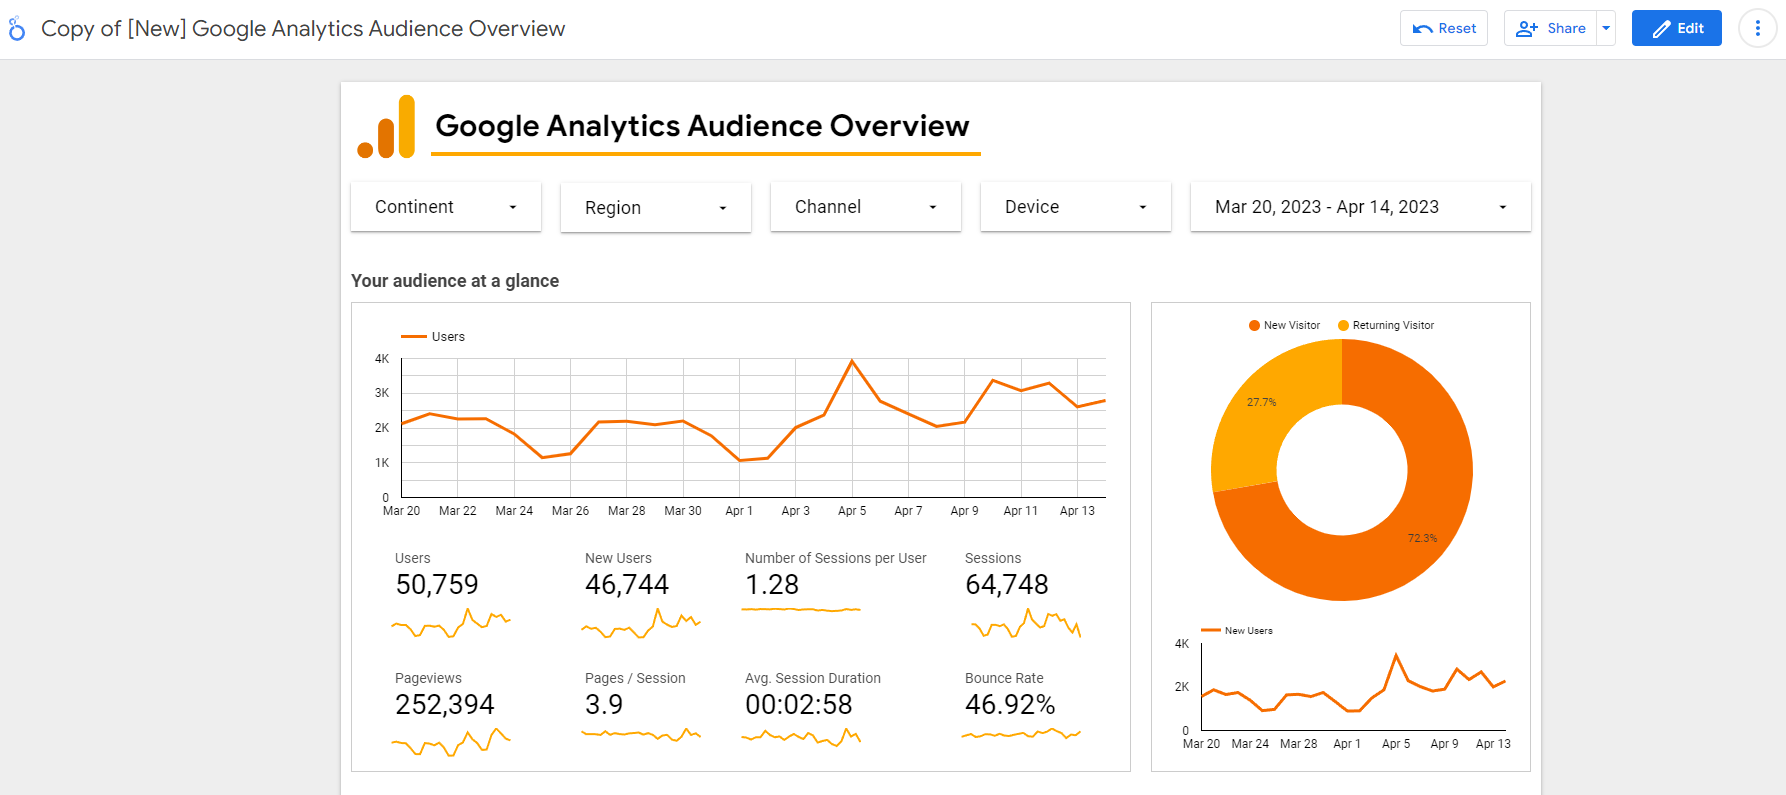
- From there, you may select the template you want to use. For the purposes of this SOP, we are going to choose Google Analytics Audience Overview.
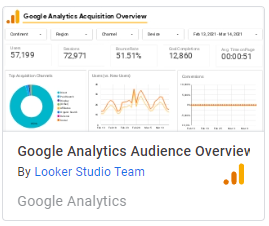
Doing so will open the template.
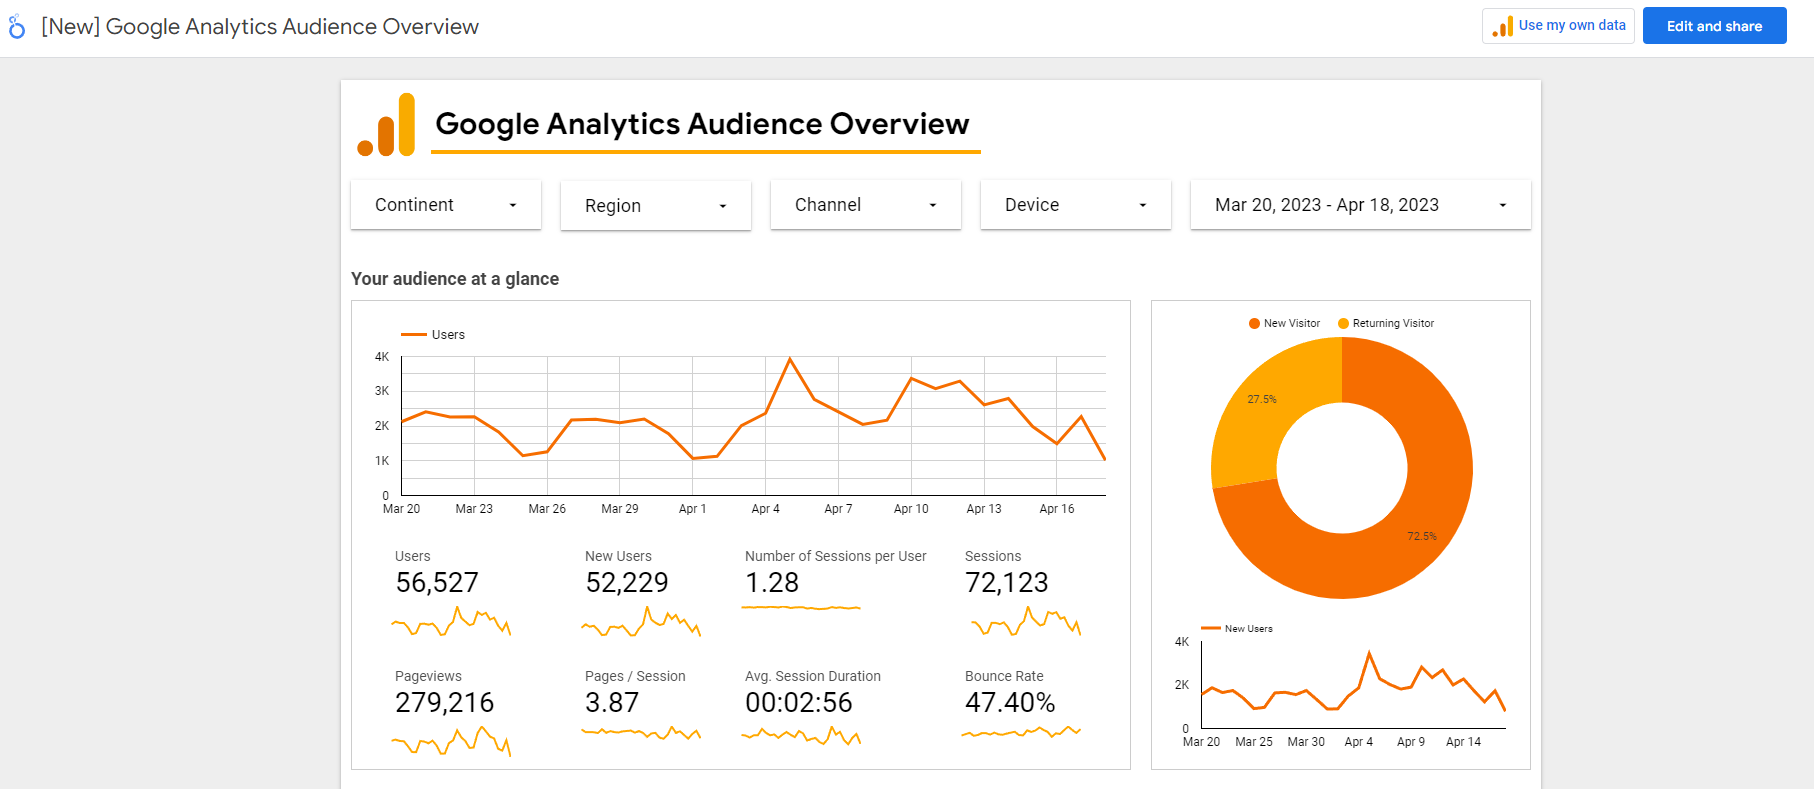
Configuring the Template
- Before we start making our edits, let us first create a copy of the template. You can do this by clicking on the Edit and share button at the upper righthand panel of the page.

A pop-up will appear, notifying you that you are about to add data to the report.
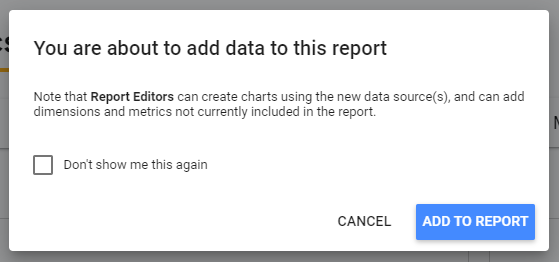
- Click on Add to Report. This will open a new window showing a copy of the template, ready for configuration.
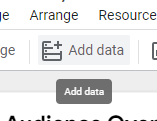
- Click on Add data to add a new data source. You will find it on the main menu.
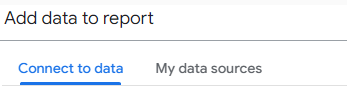
- This will reveal two options: Connect to data and My data sources. Connect to data will use Google Connectors such as Looker, Google Analytics, and even File Upload (for CSV files). Meanwhile, as the name suggests, My data sources will make use of your own data sources.
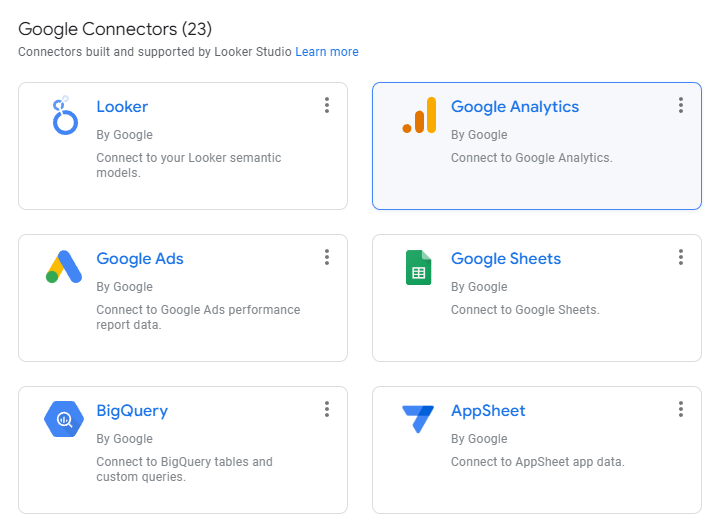
- If you don’t find the appropriate data source, then you might need to create a new one. You may do so by clicking on Connect to data and then selecting the right connector. For the purposes of this SOP, let’s say that the right connector is Google Analytics.
- Looker Studio will walk you through the process of adding your data. Just follow the prompts. In this case, Looker Studio is asking for authorization for our Google Analytics account, so we will click on the Authorize button.
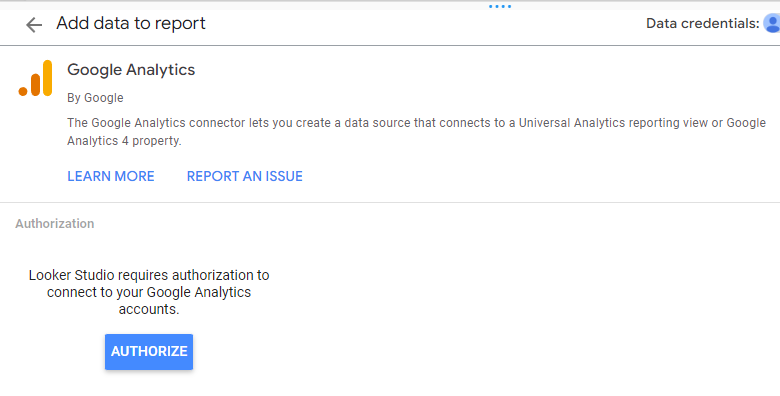
It then requested to select the appropriate account. We have created a Demo Account for the purposes of this SOP.
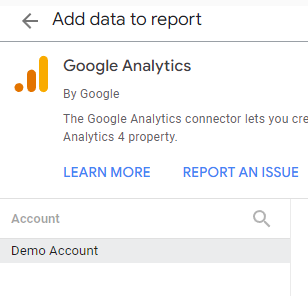
It then revealed a selection of properties. Choose the right one and click on the Add button at the bottom right-hand part of the page.
- It will show a pop-up notifying you that you are about to add the data. For the purposes of this report, we are going to use a sample property from Google Analytics 4.
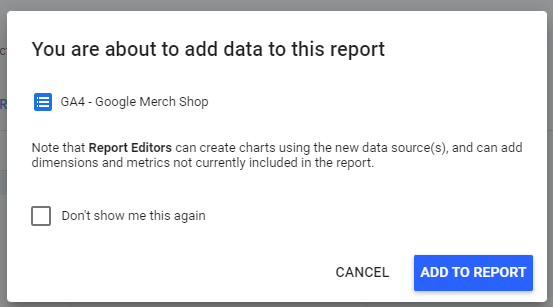
Then, we’ll click on Add to Report.
- Congratulations! You have just added your own data to the report. Since it is an interactive report, you may click on View to further interact with it. You also have the option to share the report with clients, team members, or basically anyone you want to access it. To do so, just click on the Share button beside View.

- You can further configure your report by renaming it, adding your logo, or playing around with the widgets. You will find that most elements are clickable and editable.
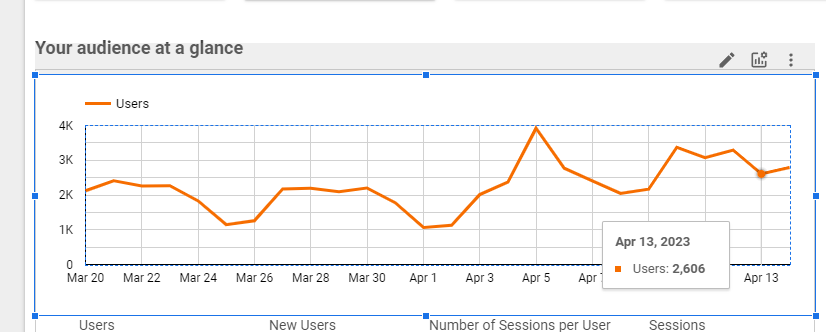
- You can learn more about editing reports by checking out this guide.
Conclusion
You’re done! Remember, the digital world is ruled by data. Understanding what these information mean is crucial to achieving online success. That said, they can be challenging to comprehend especially if your data points are coming from multiple and separate sources. Fortunately, there are tools such as Google Data Studio (also known as Looker Studio) that can compile these sources efficiently in interactive reports.
-
To begin, log into Looker Studio using your Google account.
-
Choose the appropriate template from the Template Gallery.
-
Add your data sources and properties to create the report you need.
-
Configure your report as necessary.
-
You may view the report and share it with others.