
Ecommerce Case Study: Conversion Rate Before and After
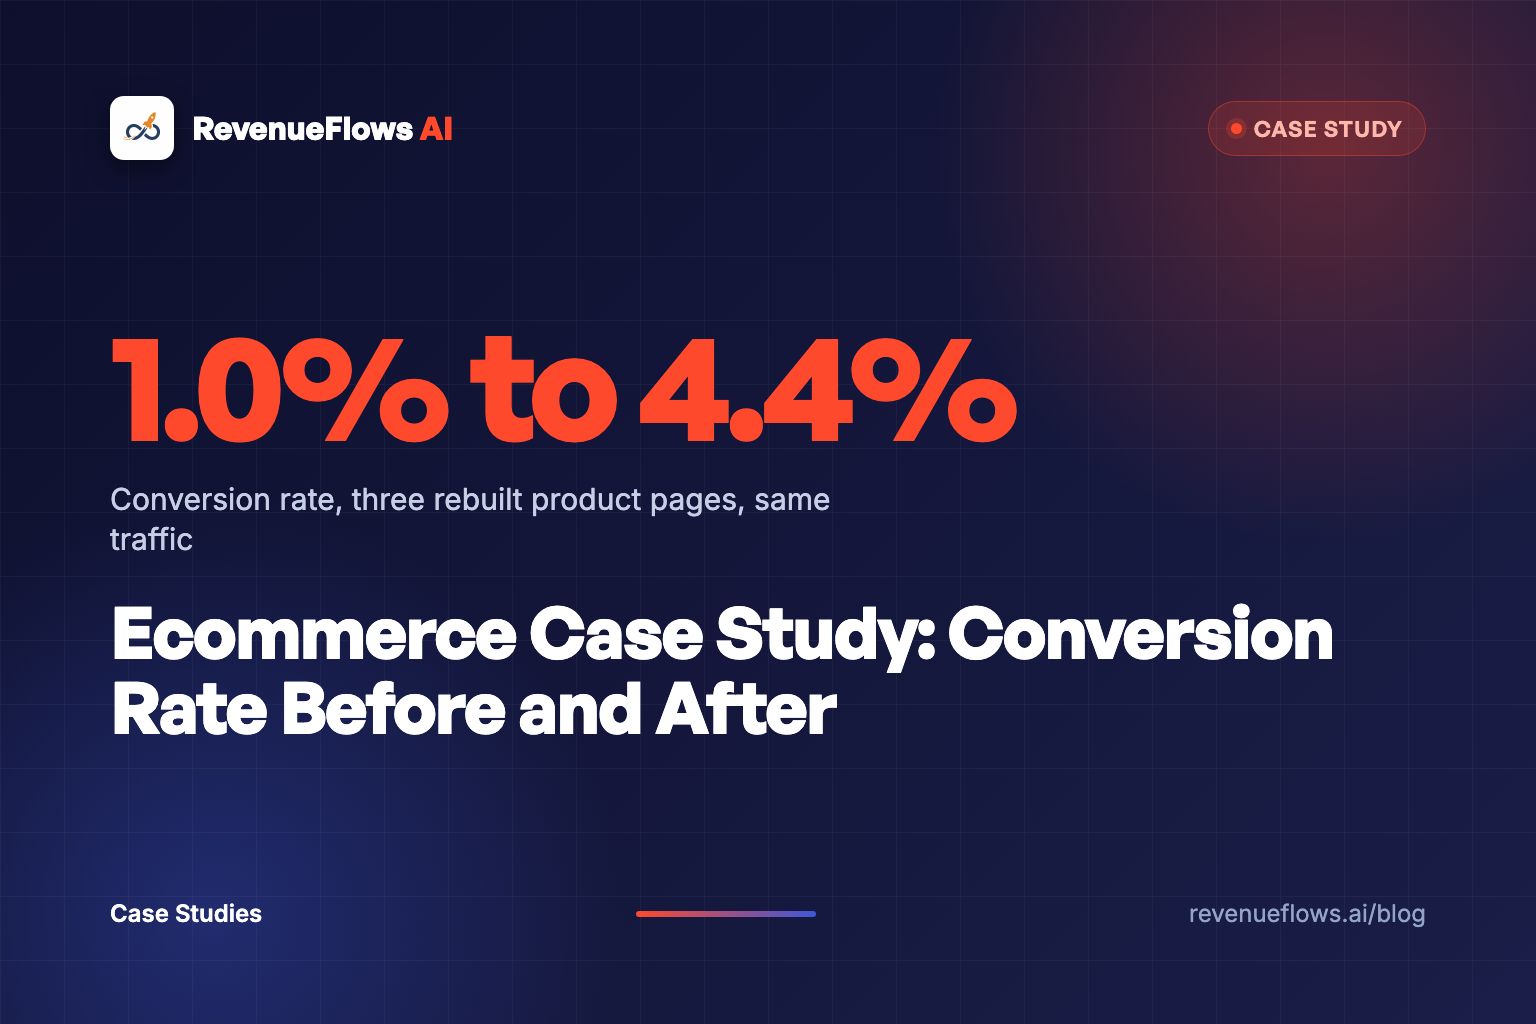
Three rebuilt product pages, the same traffic, and conversion rates that went from 1.0% to 4.3%, 4.4% and 4.3%. Here's what we measured, how we measured it, and the first-week number we refused to report.

I don't trust most conversion rate case studies.
And I'll admit something. The first number our own bedding client showed me, I didn't trust either.
So here's the short answer this ecommerce case study conversion rate breakdown gives you. Three product pages on one Shopify bedding store were rebuilt. Before, all three converted at 1.0%. After, on the same traffic, they converted at 4.3%, 4.4% and 4.3%. Store-wide, conversion rate went from 1.0% to 3.5% and average order value went from $125 to $231. See the full case study numbers on our results page. Real client numbers, not typical results, and not a promise of what your store will do.
The rest of this post is the part most case studies skip. What we counted. What we refused to count. And how you'd run the same before and after on your own store without fooling yourself.
What does this ecommerce case study conversion rate data actually show?
Here's the whole thing in one table. Every row is a page, and every number comes from /results.
| Page | Conversion rate before | Conversion rate after | Average order value after | Revenue per visitor after | On 10,000 visitors |
|---|---|---|---|---|---|
| Copper Bamboo Sheets | 1.0% | 4.3% | $221 | $9.50 | $95,000 |
| Adjustable Pillows | 1.0% | 4.4% | $152 | $6.68 | $66,800 |
| Cooling Bamboo Sheets | 1.0% | 4.3% | $254 | $10.92 | $109,200 |
| Whole store | 1.0% | 3.5% | $231 | $8.10 | $81,000 |
Before, every page sat at a conversion rate of 1.0% and an average order value of $125. That means revenue per visitor was $1.25. On 10,000 visitors, that's $12,500.
Real client numbers from /results. All three pages started at 1.0% on the same traffic.
Read the chart again. Three different products, three different price points once the orders grew, and the conversion rates landed within 0.1 points of each other.
That's the first thing that made me take this seriously. One page jumping is a story. Three pages landing in the same spot looks like a system.
One page jumping is a story. Three pages landing in the same spot looks like a system.
If you want the product-by-product teardown, it's already written: the copper bamboo sheets case study, the cooling sheets case study and the pillow product page case study. This post sits above them. It's about the measuring.
What exactly did we measure, and what did we ignore?
Conversion rate sounds simple until two people argue about it.
Shopify's own reports define it as the percentage of sessions that resulted in a purchase. Sessions, not visitors. Purchases, not add to carts. If your agency is reporting add to cart rate and calling it conversion, you're reading a different movie.
We held the case study to three rules.
Baseline first. We wrote down the 1.0% and the $125 before touching anything. No baseline, no claim.
Same traffic. Every result is stated on the same visitor count. If ad spend doubles during the test, revenue going up proves nothing about the page.
Per visitor, not per month. Monthly totals hide the cause. Revenue per visitor shows whether the page got better at selling.
Run the math on a store like this, a hypothetical: 10,000 visitors at 1.0% and $125 is $12,500. Triple the traffic, change nothing, and revenue hits $37,500. "Revenue up 200%," and the page is exactly as bad as it was.
I went through a popular roundup of ecommerce case studies while writing this, and the headline percentages come without starting conversion rates or measurement windows. Maybe they're all true. You'd have no way to check.
Why did three different products land at almost the same conversion rate?
This is the cross-product view, and it's the most useful thing in the data.
Conversion rate converged. Average order value didn't.
| Page | Conversion rate lift | Average order value | Revenue per visitor |
|---|---|---|---|
| Adjustable Pillows | 1.0% to 4.4% | $125 to $152 | $1.25 to $6.68 |
| Copper Bamboo Sheets | 1.0% to 4.3% | $125 to $221 | $1.25 to $9.50 |
| Cooling Bamboo Sheets | 1.0% to 4.3% | $125 to $254 | $1.25 to $10.92 |
On 10,000 visitors, 1.0% is 100 orders. 4.3% is 430 orders. 4.4% is 440. So all three pages got roughly four times as many people to say yes.
But here's the thing. The pillow page won the conversion race and finished last on money. Conversion rate 4.4%, average order value $152, revenue per visitor $6.68. The cooling sheets converted a hair lower at 4.3% and pulled an average order value of $254. Revenue per visitor $10.92.
On the same 10,000 visitors, that's $66,800 for the pillows and $109,200 for the cooling sheets. A $42,400 gap hiding behind a 0.1 point difference in conversion rate.
If you only track conversion rate, the pillow page looks like the champion. On money, it came third.
That's why I tell founders to stop asking "what conversion rate should I hit?" and start asking what each visitor is worth. We wrote up why revenue per visitor beats conversion rate as the number to watch if you want the long version.
Why is the store number 3.5% when every page hit 4.3% or better?
Two different rulers. Don't mix them.
The 4.3% and 4.4% are page-level numbers. The 3.5% is the store-level number on /results. A store number blends every page a visitor touches, on a store with 30+ products where we rebuilt only the top 3 hero products. I'd expect it to sit below the best pages. It did.
The store-level math: conversion rate 3.5%, average order value $231. Revenue per visitor $8.10 (3.5% x $231 is $8.09, rounded). On 10,000 visitors, that's $81,000 instead of $12,500. A gap of $68,500 a month, and 6.5x the starting number.
Here's where case studies quietly cheat. Take a store-level before, compare it to your single best page's after, and the lift looks bigger than anything that happened. It's the most common trick I see in agency decks. Same ruler before and after, every time.
Why didn't we report the first-week number?
Because it was the best number, and it wasn't true yet.
In its first week live, our bedding client's conversion rate jumped from 1% to 4.5% and average order value from $125 to $250. That's on the homepage FAQ, and it's real. Then it settled. The steady-state numbers are the 3.5% and $231 above.
If we'd stopped the clock in week one, we'd have a prettier case study and a wrong one.
Evan Miller's classic piece on how not to run an A/B test explains the trap. Checking results over and over and stopping when they look good inflates your false positives, in his worst case to 26.1% instead of the 5% you think you're getting. His fix is boring and correct: decide the sample size in advance and don't peek.
For contrast, here's an agency case study done properly on method. Seer Interactive's Trex test ran a 4-week A/B test on a homepage call to action and reported a 168% higher ecommerce conversion rate plus a 56% higher average order value. You can argue with the result. You can't say they hid the method.
A first-week number is a mood. A steady-state number is a result.
How do you run a conversion rate before and after on your own store?
Five steps. Do them in this order.
- Pick one product page that already gets the most traffic.
- Record 30 days of conversion rate and average order value.
- Freeze ad budgets, prices and promos during the test.
- Change the page, then wait out a window you chose upfront.
- Compare revenue per visitor, and check it against banked revenue.
That last step is the one people skip. Our client's /results page shows a bank screenshot: $67,565 from 8,200 clicks. At the old $1.25 per visitor, those same 8,200 clicks would have made $10,250. That's $57,315 that would have stayed on the table. Dashboards can be argued with. A deposit can't.
If you want to run a true split test instead of a before and after, our ecommerce A/B testing guide covers sample sizes and tools. And if your testing app reports a probability to win instead of significance, read Bayesian vs frequentist A/B testing before you call a winner. A before and after is faster. A split test is cleaner. Know which one you ran when you tell the story.
Plug the store-level numbers into the calculator below, then swap in your own.
What does this case study not prove?
I'd rather you hear this from me than find it yourself.
It doesn't prove your store will hit 4.3%. Bedding has natural add-ons, and a bed is a set. A single-SKU supplement store won't bundle the same way, so the average order value side may move less.
And a before and after can't fully rule out timing. That's why we lean on three pages moving together, a steady-state window, and a bank screenshot instead of one dashboard number.
If you sell on Amazon and want the profit-per-sale version of this kind of proof, the Amazon to Shopify case study runs the same discipline on fees, ad costs and net profit. And the full case study library puts every result we have in one place.
How is AI changing the before and after?
Building used to be the slow part. A page rebuild meant a copywriter, a designer and a few weeks of back and forth, so most founders tested maybe twice a year.
That's changed. On our homepage the line is that you drop in any product URL and the AI writes the copy, designs the images and builds the page in less than 15 minutes. When building takes minutes, the bottleneck moves to measurement. So the edge goes to the founder with a clean baseline and the patience to wait out the window.
Fast pages and sloppy measurement is just a faster way to fool yourself.
Questions founders ask about this case study
What did this ecommerce case study show about conversion rate? Three rebuilt product pages went from 1.0% to 4.3%, 4.4% and 4.3% on the same traffic. Store-wide, conversion rate went from 1.0% to 3.5% and average order value from $125 to $231.
Why is the store-level conversion rate lower than the product pages? Different rulers. A store number blends every page a visitor touches, so it sits below your best pages. Compare page to page and store to store.
How long should you measure a before and after? Pick the window before you start. Our client spiked to 4.5% in week one and settled at 3.5%. Stopping early would have overstated the result.
Is conversion rate the right number to judge a redesign? Half of it. The pillow page had the best conversion rate, 4.4%, and the lowest revenue per visitor, $6.68. Judge pages on conversion rate multiplied by average order value.
Can a before and after prove the page caused the lift? Not alone. Hold traffic and prices steady, log every other change, and check banked revenue.
What to do next
Open your Shopify analytics today. Find your highest-traffic product page and write down two numbers from the last 30 days: its conversion rate and its average order value. Multiply them. That's your honest before, and without it no after you ever report will mean anything.
Book Your Profit Audit
On the call we'll pull your real baseline, page by page, and show you which lever is stuck: conversion rate, average order value, or both. Then we'll show you how to rebuild a high-converting product sales page in less than 15 minutes.
Or go here to check it out → revenueflows.ai
P.S. A case study without a baseline is a trophy. Measure your before this week, so your after is a receipt.
Frequently asked questions
What did this ecommerce case study show about conversion rate?
Three rebuilt product pages on a Shopify bedding store went from a 1.0% conversion rate to 4.3%, 4.4% and 4.3% on the same traffic. Store-wide, conversion rate went from 1.0% to 3.5% and average order value from $125 to $231. Real client numbers, not typical results, and not a promise of what your store will do.
Why is the store-level conversion rate lower than the product page conversion rates?
They measure different things. A product page number counts sessions on that page. A store number blends every page a visitor touches, so I'd expect it to sit below your best pages. Never compare a page-level after to a store-level before.
How long should you measure a conversion rate before and after?
Decide the window before you start and don't stop early because the number looks good. Our own bedding client spiked to 4.5% in the first week and settled at 3.5%. If we'd reported week one, we'd have overstated the result.
Is conversion rate the right number to judge a product page redesign?
Only half of it. The pillow page had the best conversion rate of the three, 4.4%, and still earned the least per visitor, $6.68, because its average order value only reached $152. Judge a page on revenue per visitor: conversion rate multiplied by average order value.
Can a before and after test prove the page caused the lift?
Not by itself. A before and after comparison can be fooled by seasonality, a traffic mix change or a promo. Hold traffic steady, log every other change in the window, and check the banked revenue, not only the dashboard percentage.