
Ecommerce Case Studies With Real Numbers: What Moved Revenue
Most ecommerce case studies are trophies: a big percentage and no baseline. These are receipts. A bedding brand, three Amazon products and a new launch, every number with its inputs.

Most ecommerce case studies are trophies.
A logo. A big percentage. A founder smiling next to a chart with no axis labels. And nowhere on the page, not once, the number the store started from.
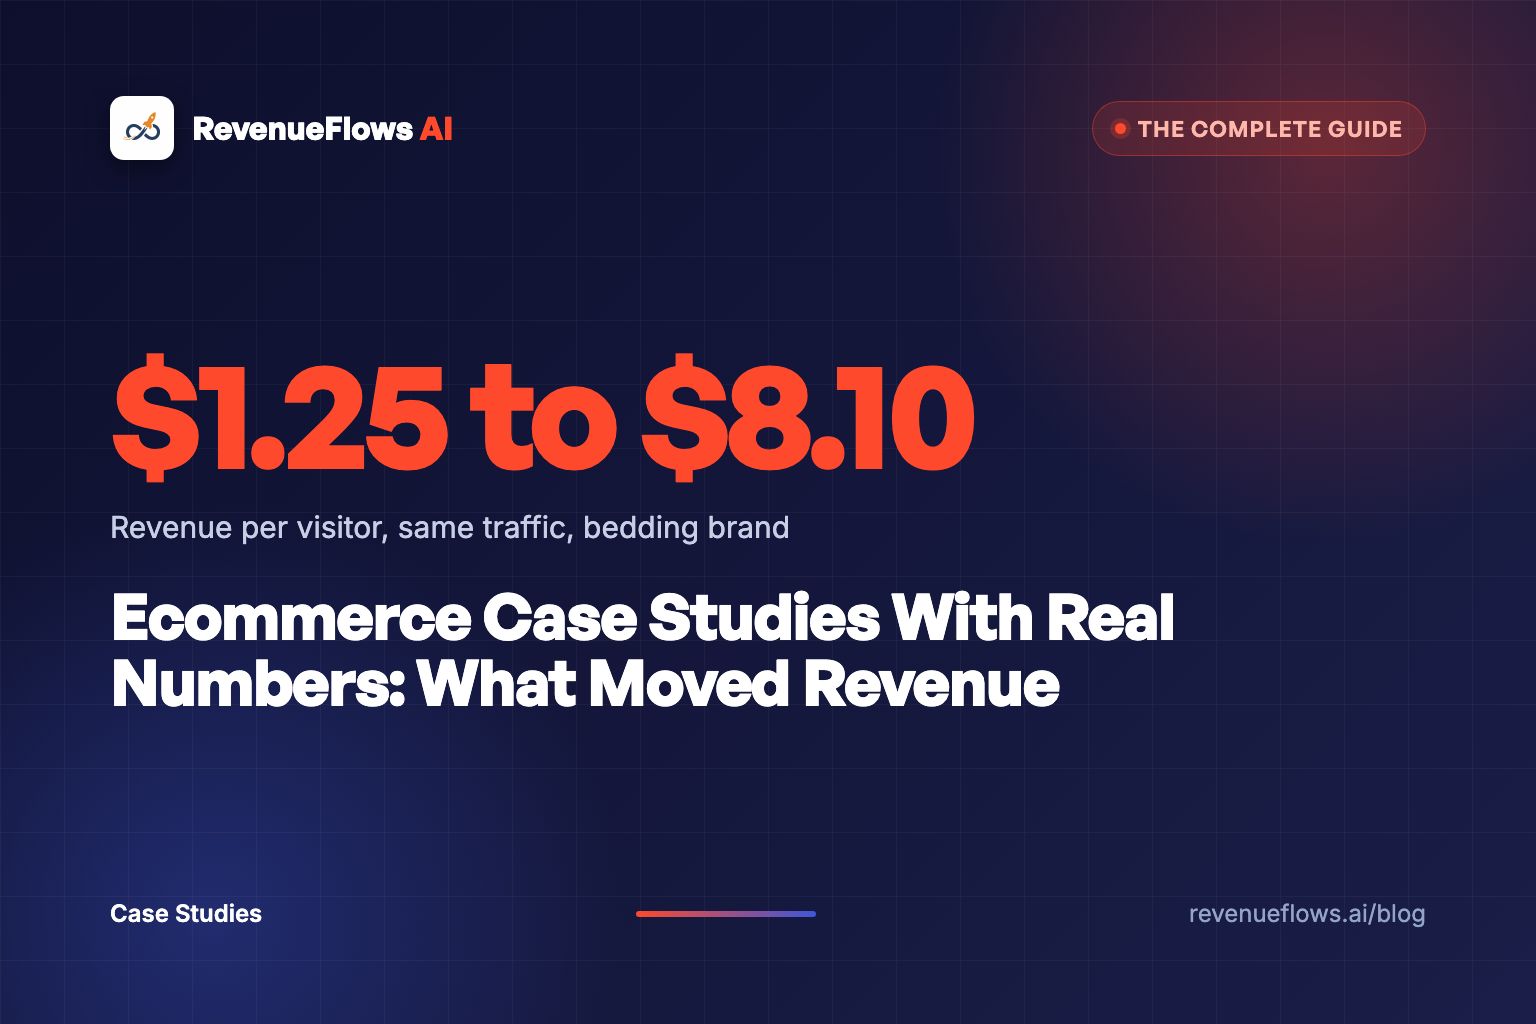
So here's the short answer. The ecommerce case studies worth your time are receipts, and a receipt shows three things: the starting numbers, the same traffic before and after, and the result per visitor or per sale. This page is our receipt drawer. A bedding brand that went from a conversion rate of 1.0% and an average order value of $125 (revenue per visitor $1.25) to 3.5% and $231 (revenue per visitor $8.10). On 10,000 visitors, that's $12,500 before and $81,000 after, a gap of $68,500 a month. See the full case study numbers on our results page. Real client numbers, not typical results, and not a promise of what your store will do.
Then three Amazon products that earned more profit per sale on Shopify, a brand-new product that reached $50K a month in 6 months, two public brands whose offers did the heavy lifting, a checklist for reading anyone's case study (ours included), and a plain list of what this data does not prove.
A trophy tells you someone won. A receipt tells you what they paid, what they got, and whether you can buy the same thing.
I'm going to be annoying about inputs on this page. That's on purpose. I've sat through too many agency pitch decks where a giant revenue percentage turned out to mean "we tripled their ad budget." You deserve the math.
How we measure: baseline first, same traffic
Every case study on this page runs on one number. Here's the definition, because the rest of the page falls apart without it.
Revenue per visitor is what a store earns for every person who lands on the page: conversion rate multiplied by average order value. A page converting 1.0% of visitors at a $125 average order value earns $1.25 per visitor. Raise either number and every visitor becomes worth more, with no extra traffic.
We wrote a full explainer on what revenue per visitor is and why it beats conversion rate as the number to watch. The short version: conversion rate alone lies to you. A page can convert more people into smaller orders and make less money. Average order value alone lies too. Multiply them and the lies cancel.
Then three rules. We hold our own results to them, and you should hold everyone else's to them.
Rule 1: baseline first. Before we touch a page, we write down the conversion rate and the average order value it's producing right now. No baseline, no case study. You can't claim a lift from a number you never measured.
Rule 2: same traffic. The before and after get compared on the same visitor count. That's why every figure on this page is stated "on 10,000 visitors." If a brand doubled its ad spend during the test, revenue going up proves nothing about the page.
Rule 3: per visitor or per sale. Totals hide things. Revenue per visitor shows whether the page got better at selling. Profit per sale shows whether the business got better at keeping the money. We report one or both, never just the monthly total.
Now watch what happens when you skip rule 2. Run the math on a store like this, a hypothetical: 10,000 visitors a month at 1.0% and $125 is $12,500. The owner triples ad spend to 30,000 visitors, changes nothing on the page, and revenue hits $37,500. An agency could honestly write "revenue up 200%." The page is exactly as bad as it was. Every visitor is still worth $1.25.
Revenue went up 200% and the page didn't get one cent better. That's why the baseline has to be per visitor.
One more measurement rule, and this one bites people who run their own tests. Decide how long a test will run before you start it. Evan Miller's classic write-up on why peeking at test results breaks them shows how checking early and stopping when the numbers look good inflates your false positives. We've seen the real version of this with our own bedding client, and I'll show you exactly where below.
And the last piece: the realized number. A projection is a promise. A bank screenshot is a receipt. On the bedding brand, the screenshot on /results shows $67,565 from 8,200 clicks. At the old page's $1.25 per visitor, those same 8,200 clicks would have made $10,250. That's the hardest proof we have, and it's the one I'd want to see if I were in your chair.
Bedding brand: three products, three levers
Here's the story.
A Shopify bedding store with 30+ products was stuck at a revenue ceiling of $15K a month. Good products. Decent reviews. Traffic coming in. And a ceiling they couldn't get through no matter what they tried on the ad side.
We didn't rebuild 30 pages. We rebuilt three. The top 3 hero products, the ones already getting the most traffic, because a better page on a product nobody visits is a museum exhibit.
Before, all three sat at the same place: conversion rate 1.0%, average order value $125, revenue per visitor $1.25. On 10,000 visitors, $12,500.
After, the store as a whole landed at a conversion rate of 3.5% and an average order value of $231. That means revenue per visitor went to $8.10, which is 6.5x the starting number. On the same 10,000 visitors, that's $81,000 instead of $12,500.
Conversion rate x average order value x 10,000 visitors. 1.0% x $125 vs 3.5% x $231 (the $8.10 per visitor figure is rounded).
But the store-level number hides the most useful part. The three products didn't improve the same way. Each one leaned on a different lever, and that's the lesson I'd steal if I were you.
| Product | Conversion rate | Average order value | Revenue per visitor | On 10,000 visitors | Boost as listed on /results |
|---|---|---|---|---|---|
| All three, before | 1.0% | $125 | $1.25 | $12,500 | baseline |
| Copper Bamboo Sheets | 4.3% | $221 | $9.50 | $95,000 | 760% |
| Adjustable Pillows | 4.4% | $152 | $6.68 | $66,800 | 534% |
| Cooling Bamboo Sheets | 4.3% | $254 | $10.92 | $109,200 | 873% |
The /results page states each boost as the after number as a percent of the before number, so $9.50 against $1.25 reads as 760%, which is 7.6 times the starting revenue per visitor.
Real client numbers from /results. Before = 1.0% x $125 for all three products.
Look at the pillows first. Highest conversion rate of the three, 4.4%. Lowest average order value, $152. So the pillow page won on the conversion lever. More people said yes. The order didn't grow much. That's a $6.68 visitor.
Now the cooling sheets. Nearly the same conversion rate, 4.3%. But the average order value went to $254, more than double the old $125. Same yes rate, much bigger yes. That's a $10.92 visitor, the best of the three.
The copper sheets sit in between. 4.3% and $221. Both levers moved, neither to the extreme. $9.50 a visitor.
The pillows won on "yes." The cooling sheets won on "how much." Same store, same system, different lever. That's why you judge a page per visitor.
Here's the thing. If this brand had only tracked conversion rate, the pillow page would look like the champion. It isn't. On 10,000 visitors, the pillow page makes $66,800 and the cooling sheets page makes $109,200. That's a $42,400 gap hiding behind a 0.1 point difference in conversion rate.
I'll be straight about something. I'm not going to hand you a line-by-line list of which sentence we changed on which page and pretend that sentence is the reason. Pages don't work that way. A page is a sequence of answers to questions a buyer is asking, and the sequence is what sells. What the numbers can tell you is which lever each page moved, and that's the part you can actually use on your own catalog.
If you want the longer version of this brand's story, there's a bedding product page teardown covering the same client. Where its rounding differs from what's on this page, the /results page is the source of record.
Amazon to Shopify: profit per sale, not revenue
Amazon sellers ask me the same question every week. "Why would I leave a platform that already has the buyers?"
Fair question. Here's my answer, and it's three products long.
Amazon takes 15% of every sale as a referral fee on these products. On Shopify, the platform and payment fees in these breakdowns ran 3%. That gap alone matters. But the fee isn't where the real money came from. The real money came from the order getting bigger.
Start with the first product, an animal repellent listed on /results as Smart Mole. It went from $8K a month on Amazon to $30K a month on Shopify. Here's the Amazon side, per sale, from the breakdown on /results:
| Smart Mole on Amazon | Per sale |
|---|---|
| Product price | $17.95 |
| Landed cost | -$4.50 |
| Shipping fees | -$4.24 |
| Platform fee (15%) | -$2.69 |
| Gross profit | $6.52 |
| Advertising | -$2.69 |
| Net profit per sale | $3.83 |
Add it up yourself: $17.95 minus $4.50, $4.24 and $2.69 is $6.52. Minus $2.69 in ads is $3.83. That's what one Amazon sale kept.
On Shopify, the same product sold at $24.95, and the average order value climbed to $101.38 because buyers were taking home more than one unit. Advertising cost more per sale on Shopify, $26.36 against $2.69, and I want you to see that number, because it's the part people leave out. Shopify traffic isn't free. But the bigger order paid for it and then some. Net profit per sale: $48.27. After paying for ads and inventory.
The Amazon listing sold more units. The Shopify page kept more money. Only one of those pays your rent.
The other two products follow the same shape.
| Product | Amazon price | Shopify average order value | Net profit per sale, Amazon | Net profit per sale, Shopify |
|---|---|---|---|---|
| Smart Mole | $17.95 | $101.38 | $3.83 | $48.27 |
| Smart Rodent | $29.95 | $177.75 | $7.73 | $78.87 |
| Smart Animal | $49.95 | $210.86 | $17.58 | $134.28 |
From the fee breakdowns on /results, after paying for ads and inventory.
Smart Rodent was doing $10K a month on Amazon at a $30 price. On Shopify it did $23K a month at a $177 average order value. Smart Animal I'll come back to in the next section, because it's the launch story.
Now here's the math that changes how you think about this. Say you want $1,000 a day in profit from Smart Mole. On Amazon, at $3.83 a sale, you need 262 sales a day. On Shopify, at $48.27 a sale, you need 21. That's the same calculator logic that sits under each case study on /results, flipped to profit mode.
Two hundred and sixty-two orders means inventory, returns, reviews to manage, and a platform that can change its fee schedule on a Tuesday. Twenty-one orders means a page doing its job.
Across all three Amazon products, the proof chip on /results reads "7-figures in total sales," and Smart Mole's screenshots show $529K in total sales generated. If you're an Amazon seller weighing the move, our page on why Amazon sellers are moving their winners to Shopify covers the fee side in full. For the page side, read how to write a Shopify product page for Amazon shoppers, because your buyer will have an Amazon tab open, and our note on Amazon product page conversion covers what to fix while you're still on the marketplace. And our Shopify vs Amazon revenue per visitor study sets out the two platforms side by side.
Launching a new product to $50K a month
Most case studies start with a product that was already selling. This one didn't.
Smart Animal was a brand-new product. It went from $0 to $50K a month in 6 months.
I love this one because it kills an excuse I hear constantly: "I'll fix the page once the product proves itself." Backwards. The page is how the product proves itself. A new product on a weak page looks like a bad product, and you'll kill a winner because the page couldn't sell it.
Here's how the numbers stacked up against the Amazon version of the same item.
On Amazon: price $49.95, net profit per sale $17.58. That's the per-sale math after a $7.49 referral fee (15%) and $9.99 in advertising.
On Shopify: price $79.95, average order value $210.86 (the proof screenshot rounds it to $211), net profit per sale $134.28. Or in the words on /results, instead of making $50 per order, the brand started banking a fat $134 profit per order, after paying for ads and inventory.
A new product on a weak page looks like a bad product. You'll kill a winner because the page couldn't sell it.
Notice what happened to the price. The Shopify version sold at $79.95, $30 more than Amazon. And the average order value ran past $210. A buyer on Amazon is comparing your listing to a screen full of others. A buyer on your own page is comparing your offer to their problem. The second conversation lets you sell a bigger, more complete order.
So if you're launching something this quarter, build the page for the offer you want to sell, before the traffic shows up. Our guide on writing a Shopify product page for a new product launch walks through launch week versus week five, when the cold traffic arrives and the page has to sell on its own.
What public DTC brands teach about offers
Our numbers come from our clients. But some of the clearest lessons about offers come from brands that published their numbers through press coverage and filings. I only use ones I could check against the source, and I'll link each one so you can too.
Dollar Shave Club. The brand name is the offer. You know the price promise before you ever see the page. Its launch video went up in March 2012, and the company's Wikipedia history records 12,000 orders in the first 48 hours, with subscription tiers at $4, $7 and $10 a month. In July 2016, Unilever bought it for $1 billion in cash, and retail trade press reported 2015 sales of $152 million. The University of Kansas coverage of the deal put the subscriber base at 3.2 million.
What I take from it: a razor is a tiny order. A subscription turns a tiny order into a recurring one. That's the average order value lever wearing a different outfit. The offer made each customer worth more over time, and the video made people want to find out.
Warby Parker. In its 2021 S-1 filing, Warby Parker describes Home Try-On: pick five frames, try them at home for five days, free. The same filing lists glasses starting at $95, including prescription lenses.
The lesson there is risk. The biggest objection to buying glasses online is "what if they look wrong on my face?" Warby Parker didn't argue with that objection in copy. It built the answer into the offer. Five frames, five days, zero cost to find out.
The best offers answer the buyer's scariest question before the page has to.
Here's what I want you to notice about both. Neither brand published its conversion rate or its revenue per visitor, so I can't tell you what either page earned per visitor, and I won't guess. What they show is the pattern our own case studies show: the money moved when the offer answered the question the buyer was already asking. A bigger order for Dollar Shave Club through repetition. Less risk for Warby Parker through a free trial.
If you want to raise order size without leaning on discounts, read three moves that double average order value without discounts.
How to read any case study critically
This section applies to our case studies too. Especially ours. I'd rather you trust us because the numbers survived your checklist than because the headline was big.
Start with the baseline. If a case study says "conversion rate up 150%" and doesn't tell you it started at 0.4%, you've learned nothing. Going from 0.4% to 1.0% is a 150% increase and still a weak page.
Then check the traffic. Did the visitor count stay the same, or did the brand run a sale, launch on TV, or double its ad budget during the test? If traffic changed, revenue totals are useless. You need per-visitor numbers.
Check the time window. A week-one spike is real, but it isn't the number you'll live with. Launches, email blasts to a warm list and seasonal peaks all inflate early results. Ask for the steady state.
Check the survivorship. Every agency shows its winners. Ask how many pages were rebuilt to produce the one on the slide. Ours, for the bedding brand: three pages rebuilt, three shown. That's a small sample, and I'll say so in the next section.
Then check the money that got kept. Revenue up while profit per sale falls is a treadmill, and some of the loudest ecommerce case studies online are treadmills. Look for landed cost, fees, shipping and ad cost per sale. If none of them appear, the brand might be printing revenue and bleeding cash. Our write-up of a $60K store that was actually losing money is a story about exactly that.
If a case study won't show you the starting number, it's a trophy. Put it back on the shelf.
Original studies from our free tools
People ask why we don't publish big benchmark reports with a thousand stores in them. Honest answer: we won't publish a benchmark we can't stand behind, and a benchmark is only as good as the data under it. So here's what our free tools measure today, and the studies we could publish from them once the data is deep enough. No results below. None exist yet, and I'm not going to make any up.
The revenue per visitor calculator takes sessions, conversion rate and average order value, and shows what each visitor is worth plus what the store leaves behind. The conversion rate benchmark tool compares a store's conversion rate against a niche benchmark and shows the dollar gap to the median. The product page copy grader scores product page copy out of 100 across six dimensions. The Shopify fee calculator and the Amazon FBA fee calculator show what each platform takes per order before product cost.
Studies we could run from those tools, if enough founders use them and we can anonymize the inputs properly:
- The per-visitor spread by niche. Where revenue per visitor clusters for bedding, supplements, apparel and home goods, and how wide the gap is between the middle and the top.
- Which lever is usually weaker. Whether stores under a certain order size are more often held back by conversion rate or by order value.
- Copy score versus revenue per visitor. Whether pages that score higher on the copy grader tend to earn more per visitor, or whether the grade and the money don't line up at all.
- The fee gap at real order sizes. How the Amazon versus Shopify fee difference changes as average order value grows, using the fee calculators' inputs.
If we publish any of these, the methodology goes first: how many stores, which dates, what we excluded and why. The same checklist above applies to us.
For now, our library has several audit-style write-ups built from the patterns we see on client and prospect pages: product page audit findings, a skincare store conversion audit, a home goods conversion study, a Shopify conversion rate benchmark and DTC average order value statistics. Read them for the patterns. Judge them with the checklist.
What the data does not prove
This is the section most case study pages skip. I think it's the most important one on the page.
It doesn't prove your store will do the same. These are real client numbers, not typical results, and not a promise of what your store will do. The /results page says the same thing. I mean it.
It's a small sample. One bedding brand, three products rebuilt. Three Amazon products moved to Shopify. That's six products in total. They're real, and they're honest, and six is still six. Nobody should call that a benchmark.
There's no control group. We compared each page to its own past, on the same traffic. We didn't run a half-and-half split test on every page. Seasonality and market shifts can nudge before-and-after comparisons, and I can't rule them out completely.
The first week lied a little. Remember the peeking warning? Our own bedding client is the example. In the first week after going live, her numbers ran higher than where they settled. The steady state settled at 3.5% and $231. We cite the lower, steady number. If we'd stopped the clock in week one, this page would show a bigger number and a less honest one.
We cite the steady state, not the spike. If a case study only shows you week one, ask what week eight looked like.
Profit depends on your costs. The Amazon-to-Shopify profit per sale numbers include that brand's landed cost, shipping, fees and ads. Your product has different costs. The shape of the lesson carries over. The exact dollars don't.
It proves the lever, not the recipe. What this data does show is which lever moved and how much it was worth on the same traffic. That's the part you can take to your own catalog.
Start here: the full reading list
Every case study and proof story in the library, in the order I'd read them.
The flagship bedding client
- See the full case study numbers on the results page: the store-level and per-product results, the $67,565 screenshot, and the calculators.
- Shopify bedding product page teardown: the page-level story of the same client.
Amazon to Shopify
- Shopify vs Amazon revenue per visitor: the two platforms side by side.
- How to write a Shopify product page for Amazon shoppers: winning the price check.
- Amazon product page conversion: what to fix while you're still on the marketplace.
Profit stories
- The $60K store that was actually losing money: revenue up, profit leaking.
- Do abandoned cart emails work?: the honest math on recovery flows.
Audits and benchmarks
- Shopify product page audit findings
- Shopify skincare store conversion audit
- Shopify home goods conversion study
- Shopify conversion rate benchmark
- DTC average order value statistics
The math behind every case study
- What is revenue per visitor?
- Revenue per visitor vs conversion rate
- How to increase revenue per visitor on Shopify
- Shopify revenue per visitor calculator walkthrough
Launches and offers
- Writing a Shopify product page for a new product launch
- Three moves that double average order value without discounts
If you'd rather watch than read, the full breakdown video walks through the same numbers.
Before you go, run your own starting number. The calculator below uses the example math from our homepage, not a client: a page at 1% conversion and a $50 average order value earns $0.50 per visitor. Move it to 3% and $80 and it earns $2.40, which is 4.8x from the same traffic. On 10,000 visitors, that's $5,000 becoming $24,000. Swap in your own numbers.
Ecommerce case studies FAQ
What makes a good ecommerce case study? The starting numbers, the same traffic before and after, and the result per visitor or per sale. A percentage lift with no baseline can't tell you whether the page improved or the traffic just grew.
What is the most important number in an ecommerce case study? Revenue per visitor: conversion rate times average order value. Our bedding client went from 1.0% at $125 ($1.25) to 3.5% at $231 ($8.10) on the same traffic.
Are ecommerce case study results typical? No. Case studies show winners by design. Ours are real client numbers, not typical results, and not a promise of what your store will do.
Is moving an Amazon product to Shopify more profitable? It can be, when the Shopify page sells a bigger order. Our three cases went from $3.83 to $48.27, $7.73 to $78.87, and $17.58 to $134.28 net profit per sale, after ads and inventory.
How long should a before and after test run? At least one full buying cycle, decided before you start. Our bedding client spiked in week one and settled lower, so we cite the steady state.
Where can I see the full RevenueFlows AI case study numbers? On our results page: store-level and per-product bedding numbers, three Amazon-to-Shopify fee breakdowns, and calculators for your own traffic.
What to do next
Open your Shopify analytics and write down two numbers for your best-selling product over the last 30 days: conversion rate and average order value. Multiply them. That's your baseline, your "before." Every case study on this page started exactly there, and yours can't start anywhere else.
Book Your Profit Audit
On a profit audit, Ishan Soni and the RevenueFlows AI team measure the revenue per visitor on your top products, show you which lever is weaker, and write your "before" down so any result can be checked against it. Then we'll show you how to rebuild a high-converting product sales page in less than 15 minutes.
Or go here to check it out → revenueflows.ai
P.S. Anyone can hand you a trophy. Ask for the receipt: the starting number, the same traffic, the money per visitor.
Frequently asked questions
What makes a good ecommerce case study?
A good ecommerce case study shows the starting numbers, keeps traffic the same before and after, and reports the result per visitor or per sale. If it only shows a percentage lift with no baseline, you can't tell whether the page got better or the traffic just got bigger.
What is the most important number in an ecommerce case study?
Revenue per visitor, which is conversion rate multiplied by average order value. It captures both levers at once. Our bedding client moved from 1.0% at $125 (revenue per visitor $1.25) to 3.5% at $231 (revenue per visitor $8.10) on the same traffic.
Are ecommerce case study results typical?
No, and any honest case study says so. Case studies show winners by design. Ours are real client numbers, not typical results, and not a promise of what your store will do. Use them to learn which lever moved, then test that lever on your own store.
Is moving an Amazon product to Shopify more profitable?
It can be, when the Shopify page sells a bigger order. In our three Amazon-to-Shopify cases, net profit per sale went from $3.83 to $48.27, $7.73 to $78.87, and $17.58 to $134.28, after paying for ads and inventory. Revenue alone would have hidden that.
How long should a before and after test run?
Long enough to cover at least one full buying cycle, and decide the length before you start. Stopping the moment the numbers look good inflates false positives. Our own bedding client spiked in week one and settled lower, which is why we cite the steady-state numbers.
Where can I see the full RevenueFlows AI case study numbers?
The results page on revenueflows.ai holds the bedding brand's store-level and per-product numbers, the three Amazon-to-Shopify fee breakdowns, and calculators that rerun the math on your own traffic.