
Copper Bamboo Sheets Case Study: Conversion 1 to 4.3 Percent
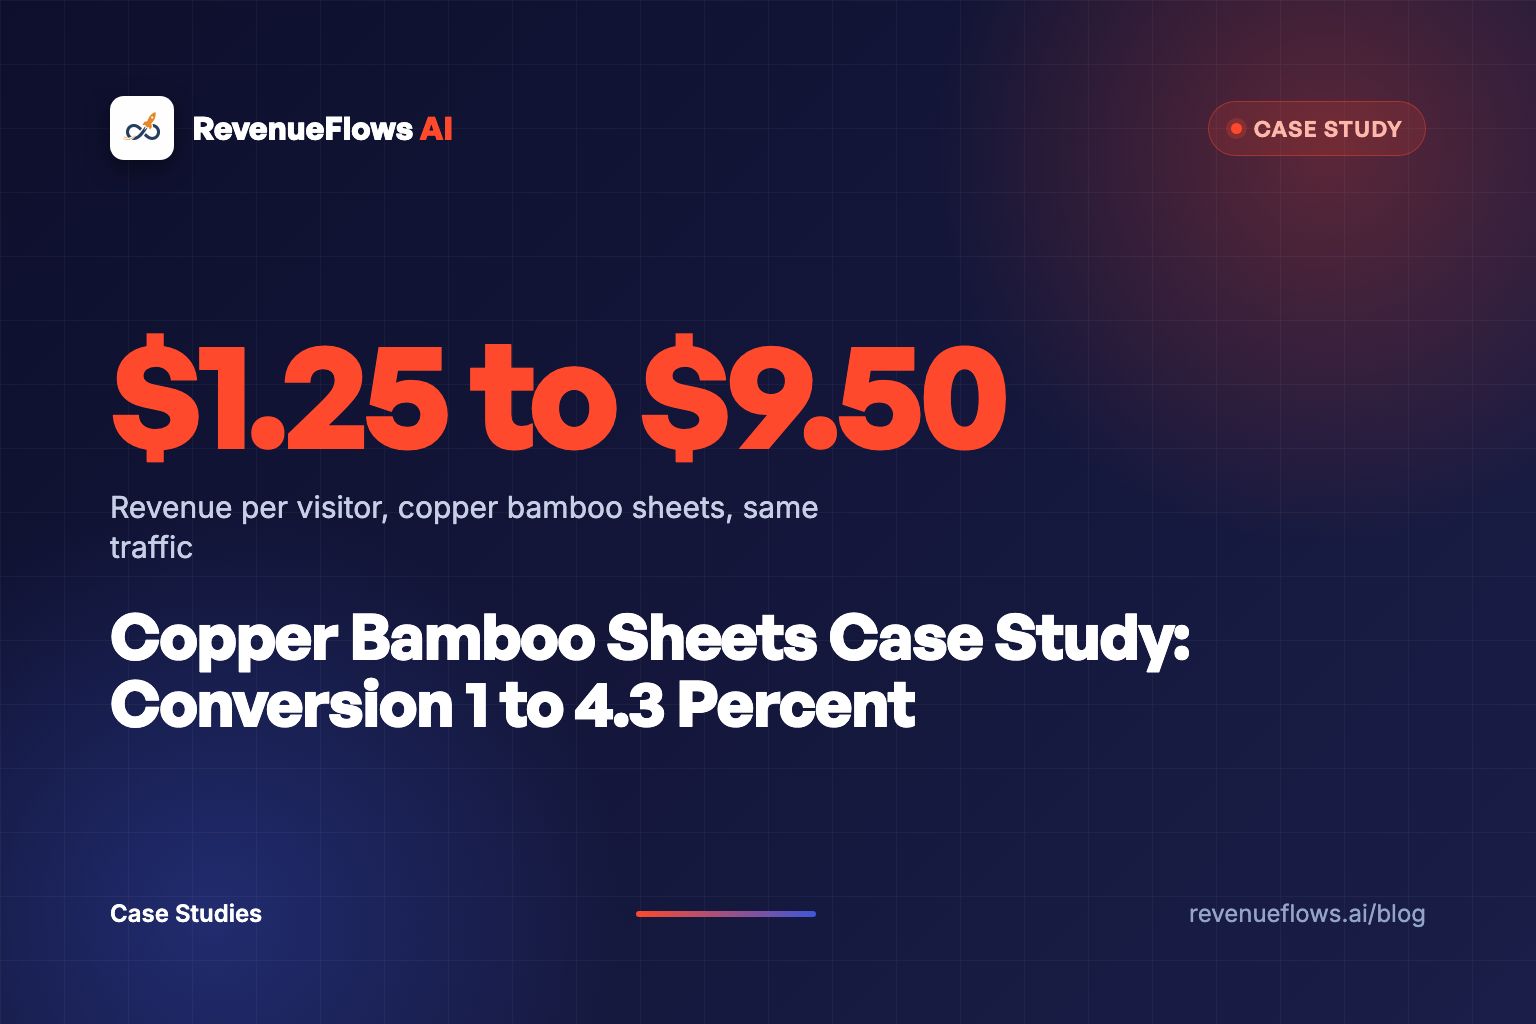
One sheet set. Same traffic. Conversion rate 1.0% to 4.3%, average order value $125 to $221, revenue per visitor $1.25 to $9.50. Here's the math, and what a rebuilt page changes.

Sheets are a hard product to sell from a web page.
You can't touch them. You can't feel the weight, or find the cool side of the pillow in the middle of the night. Every argument for spending $221 on a sheet set has to live in words and pictures, and most bedding pages make that argument with a thread count and a fabric name.
So when someone asks me for a copper bamboo sheets case study, I like the question. Sheets are the hard case. If a page can move the number on sheets, it can move it on almost anything you sell.
Here's the number first. Then the part most case studies skip.
What did the copper bamboo sheets case study measure?
One product page. A Shopify bedding store with 30+ products, stuck at a revenue ceiling of $15,000 a month. We rebuilt the top 3 hero products, and the copper bamboo sheets were product number one.
Before the rebuild: conversion rate 1.0%, average order value $125. That means revenue per visitor was $1.25. On 10,000 visitors, that's $12,500.
After the rebuild: conversion rate 4.3%, average order value $221. Revenue per visitor $9.50. On the same 10,000 visitors, that's $95,000.
That's $82,500 more from the same clicks. A 760% boost in revenue per visitor. You can see the full case study numbers for all three products. Real client numbers, not typical results, and not a promise of what your store will do.
| Key metric | Before | After |
|---|---|---|
| Conversion rate | 1.0% | 4.3% |
| Average order value | $125 | $221 |
| Revenue per visitor (conversion rate x average order value) | $1.25 | $9.50 |
| Revenue on 10,000 clicks | $12,500 | $95,000 |
Source: the per-product table on our results page.
Revenue per visitor is conversion rate multiplied by average order value. The copper bamboo sheets page went from 1.0% x $125, which is $1.25 a visitor, to 4.3% x $221, which is $9.50 a visitor. Same traffic, same product. The page did all of it.
Why does 1.0% to 4.3% matter more than the 760%?
Because the 760% is the output. The two levers underneath it are the part you can copy.
Conversion rate went 4.3 times higher. 1.0% to 4.3%. More people said yes.
Average order value went from $125 to $221. Each yes became worth 1.77 times more.
Multiply those two and you get 7.6 times the revenue per visitor, which the results page shows as 760%. One lever gets you a nice test result. Both levers get you $82,500.
Here's the thing. Most founders chase one lever. They run a headline test and leave the offer alone, or they bolt on a bundle app and leave the copy alone. The copper sheets page moved both at once, and that's the whole reason the gap is $82,500 and not $20,000.
Source: /results. Conversion rate x average order value. 1.0% x $125 = $1.25. 4.3% x $221 = $9.50. Real client numbers, not typical results.
Source: /results. Revenue per visitor x 10,000 clicks. Same traffic, same product.
Side by side with the other two hero products, the copper sheets sat in the middle. The pillows won on conversion rate (4.4%), the cooling sheets won on average order value ($254), and the copper sheets moved both levers without going to either extreme. I walk through all three, with every input shown, in the ecommerce case studies library. The store-level version of this same brand, 1.0% to 3.5% and $125 to $231, is in the bedding product page optimization teardown.
Why do sheet pages lose the sale in the first place?
Open ten bedding stores tonight and count how many product pages lead with a thread count.
That's the spec sheet habit. I know it well, because I spent years selling on Amazon, where the listing format forces you into bullets and specs. It took me longer than I'd like to admit to notice I'd carried that habit onto my own Shopify pages.
A spec sheet describes the sheets. It doesn't help anyone decide. And the buyer on a $221 sheet set has four questions running in their head that no thread count answers:
- "Will I actually sleep cooler, or is 'cooling' a word on a label?"
- "Why is this $221 when there's a $40 set two tabs over?"
- "Copper. Is that marketing, or does it do something?"
- "What happens if I hate them after a week?"
If the page leaves those open, the buyer does the selling to themselves. Most of them won't.
This is the part the research backs up. Baymard Institute's product page UX benchmark, updated in March 2026, scores only 48% of leading desktop ecommerce sites as decent or good on product page performance, and only 38% on mobile. Their testers repeatedly abandoned products that suited them because of page problems that were fixable. Those are big, well-funded stores.
A spec sheet describes. A sales page decides. The buyer who lands on a description has to close the sale on themselves, and the 1.0% conversion rate tells you how often that happens.
What changed on the page?
I'm not going to paste the client's old copy next to the new copy and claim one sentence did it. Pages don't work that way, and I'd be guessing which line mattered. What I can give you is the method, because it's the same method on every page RevenueFlows AI rebuilds, and the copper sheets page was built with it.
A high-converting product sales page carries these elements, in roughly this order:
1. A headline that names the buyer and the outcome, not the fabric. Illustrative, not the client's line: "For hot sleepers who've given up on 'cooling' sheets."
2. The price question answered above the fold. Why $221 and not $40. What the cheap set costs you in a year of pilling and replacing. The buyer is going to ask it. The page asks it first.
3. One objection handled per section. Cooling, then copper, then durability, then care, then "what if I don't love them." Each section opens on the question in the buyer's words and closes it before moving on.
4. Proof next to the claim it proves. A review that says "I stopped waking up sweating" belongs under the cooling section, not parked in a widget at the bottom of the page where nobody scrolls.
5. The risk reversal stated before they ask. Return window, exchange, trial period, whatever the store actually offers. In plain words, near the button.
6. Photos that show what the words claim. The sheet on a made bed, the drape, the weight in a hand. A folded stack on white tells the buyer nothing they couldn't get from the fabric name.
7. An offer, not a price. This is the lever that moved the $125 to $221, and it gets its own section below.
Drop in a product URL and RevenueFlows AI writes the copy, designs the images, and builds the page, in less than 15 minutes. The method above is what it builds. The copper sheets numbers are what that method produced on one product.
How did the average order value go from $125 to $221?
Conversion rate makes the page a better closer. Average order value makes every close worth more. The second lever is the one most conversion advice forgets, and it's the one that does the most for profit, because the extra $96 per order rides on the same ad spend and the same shipping box.
Here's the method. The page sells a complete bed, and the single sheet set becomes the smallest option, not the only option. A set with pillowcases. The bigger size shown as the default, with the smaller one as a step down. One matching add-on next to the add to cart button. The buyer who came for sheets leaves with a bed, and nobody got a discount to do it.
Conversion rate is how often the page wins. Average order value is how much it wins. You need both, and the second one is the one your agency forgot to mention.
I break down the no-discount version of this lever in how to boost average order value without discounts. The short version: a discount pays the buyer to overlook what the page failed to say. An offer gives them a reason to buy more at full price. The one-click offer after payment is the small lever that stacks on top of it, and post-purchase upsells on Shopify covers which offers a buyer accepts once the sheet set is already paid for.
What would these numbers mean on your traffic?
Your numbers won't be these numbers. Your product, your price, your traffic. But the math is the same math, and it's worth running.
Revenue per visitor is conversion rate times average order value. If you've never computed it for your hero product, what is revenue per visitor walks through it in two minutes, and the revenue per visitor calculator post does the arithmetic for you.
The calculator below starts with the copper bamboo sheets numbers from the results page. Change the inputs to your own hero product and watch the monthly gap update.
Run the math on a store like this, a hypothetical: 6,000 visitors a month to a hero product page, converting at 1.4% with an $88 average order value. That's $1.23 a visitor, and $7,392 a month from that page. Move it to 2.8% and $120, which is a smaller lift than the copper sheets got on either lever, and it's $3.36 a visitor. $20,160 a month. Same 6,000 visitors.
What to do next
One action. Open Shopify analytics, pull your hero product page's conversion rate and average order value for the last 30 days, and multiply them. Write the per-visitor number on a sticky note and put it on your monitor.
That's your "before." Everything in this copper bamboo sheets case study is a before and an after on the same traffic. You can't have an after until you've written down the before.
Questions founders ask about this case study
What were the results in the copper bamboo sheets case study? On one product page, conversion rate went from 1.0% to 4.3% and average order value from $125 to $221, so revenue per visitor went from $1.25 to $9.50. On 10,000 clicks that's $95,000 instead of $12,500. Real client numbers, not typical results, and not a promise of what your store will do.
How is a 760% boost in revenue per visitor calculated? Revenue per visitor is conversion rate multiplied by average order value. Before: 1.0% x $125 = $1.25. After: 4.3% x $221 = $9.50. $9.50 is 7.6 times $1.25, which the results page shows as 760%.
Did the brand change its ads or traffic to get these results? The case study holds traffic constant on purpose. The comparison is the same 10,000 clicks landing on the old page versus the rebuilt page. That's the only honest way to measure a product page, because a traffic change would hide what the page did.
Will a sheet brand get the same numbers from a page rebuild? No case study can promise that, and I won't. What transfers is the method: name the buyer, answer the price question above the fold, handle one objection per section, put proof next to the claim, and build the offer as a set. Then measure your own before and after per visitor.
Book Your Profit Audit
The copper bamboo sheets page went from $1.25 to $9.50 a visitor without a single new click, and your hero product has its own version of that gap sitting in it right now. On a free profit audit we'll find the number your page is producing today, show you where it's leaking, and show you how to rebuild a high-converting product sales page in less than 15 minutes.
Or go here to check it out → revenueflows.ai
P.S. A spec sheet describes. A sales page decides. The copper sheets didn't change. The page stopped describing them and started closing.
Frequently asked questions
What were the results in the copper bamboo sheets case study?
On one product page, conversion rate went from 1.0% to 4.3% and average order value from $125 to $221, so revenue per visitor went from $1.25 to $9.50. On 10,000 clicks that's $95,000 instead of $12,500. Real client numbers, not typical results, and not a promise of what your store will do.
How is a 760% boost in revenue per visitor calculated?
Revenue per visitor is conversion rate multiplied by average order value. Before: 1.0% x $125 = $1.25. After: 4.3% x $221 = $9.50. $9.50 is 7.6 times $1.25, which the results page shows as 760%.
Did the brand change its ads or traffic to get these results?
The case study holds traffic constant on purpose. The comparison is the same 10,000 clicks landing on the old page versus the rebuilt page. That's the only honest way to measure a product page, because a traffic change would hide what the page did.
Will a sheet brand get the same numbers from a page rebuild?
No case study can promise that, and I won't. What transfers is the method: name the buyer, answer the price question above the fold, handle one objection per section, put proof next to the claim, and build the offer as a set. Measure your own before and after per visitor.