
TikTok Viral Products Lifespan: How Long Trends Last
Nearly half of TikTok trends are gone within five days. Here's the 90-day tracking study that tells you which viral products fade, which ones hold, and what to do with your page either way.

Most TikTok trends are dead before your inventory ships.
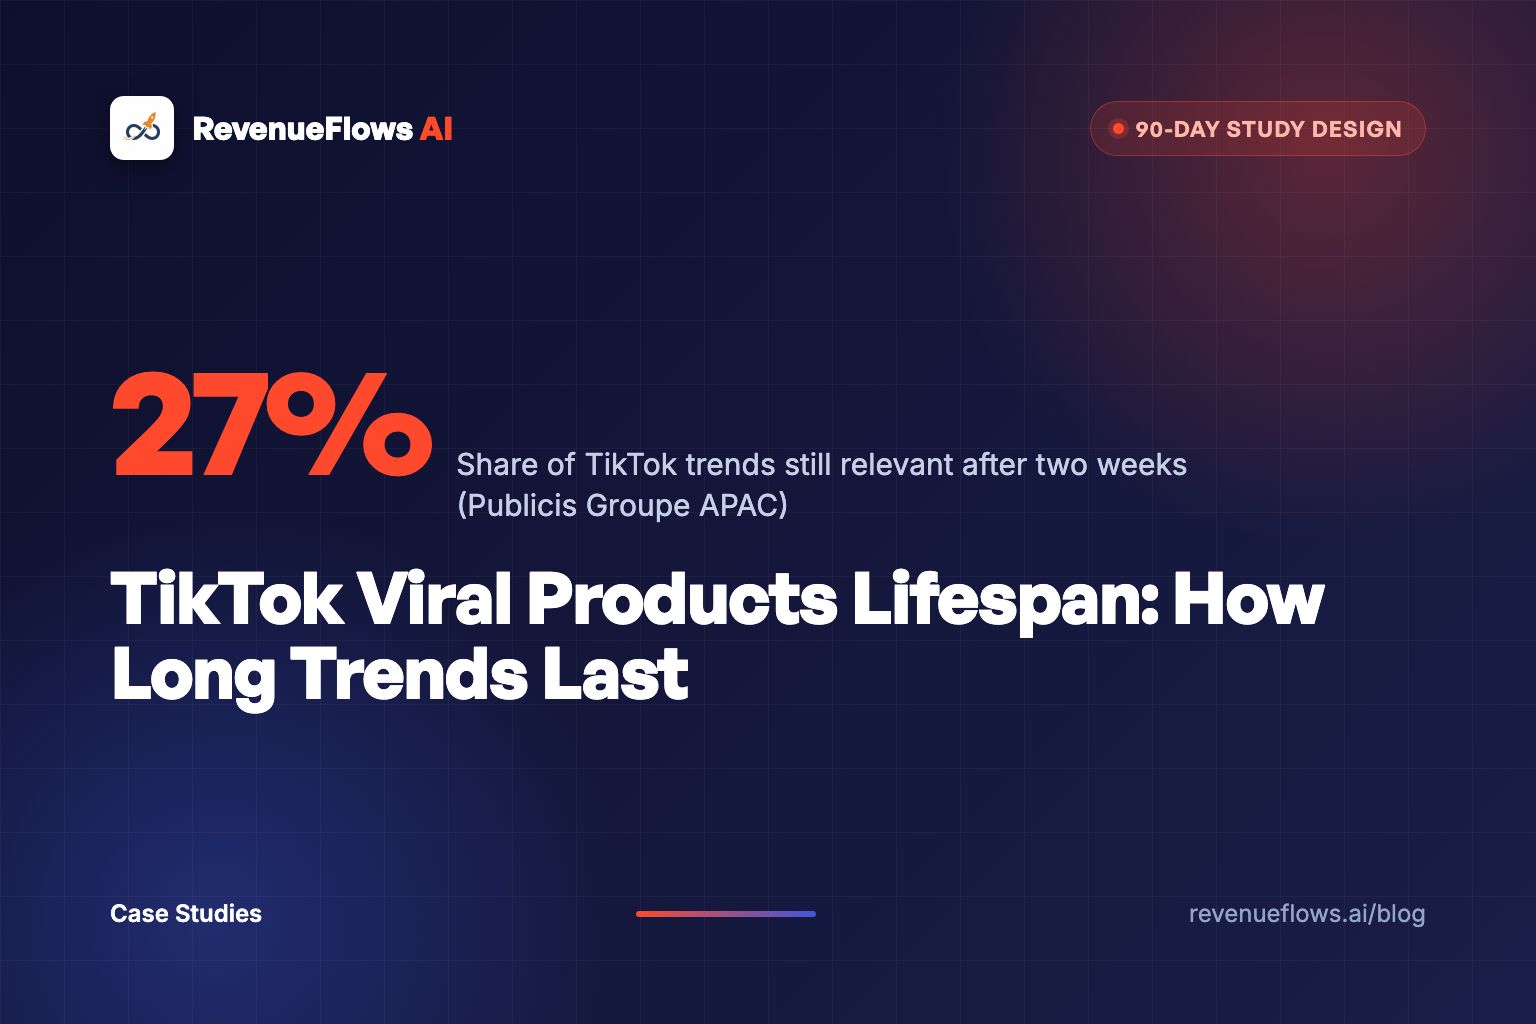
That's the short answer on the TikTok viral products lifespan, and it comes from the biggest study I've found on it. Publicis Groupe APAC tracked trends across seven markets and found nearly half of TikTok trends disappear within five days. Only 27% stay relevant beyond two weeks.
So most viral products fade in days to weeks. A small group holds for months, and a rare few turn into businesses.
Nobody can tell you in advance which bucket your product lands in. Not me, not a trend tool, not the creator with 4 million followers. You find out by measuring it. This post is the 90-day study to do exactly that, on your own products, with your own numbers. And then the part almost everyone skips: what to do with the product page while the wave is still up.
The trend decides how long the traffic lasts. Your page decides what each visitor is worth while it does.
How long do TikTok viral products actually last?
Here's what the published research says, with the source for every number. I'm not going to hand you a made-up benchmark. We haven't run this study across a pool of stores, and I won't pretend we have.
| Finding | Number | Source |
|---|---|---|
| TikTok trends that disappear within five days | Nearly half | Publicis Groupe APAC, via Marketing-Interactive |
| TikTok trends still relevant after two weeks | 27% | Publicis Groupe APAC, via Mission Media |
| When a TikTok video collects its biggest surge in views | Days 1 to 5 | Socialinsider, 6M posts from 72K accounts |
| Typical TikTok video lifecycle | 20 to 30 days | Socialinsider |
| When most viral TikTok videos peak | About 8 days | Spate |
| A product that held: Stanley revenue | $73M (2019) to a projected $750M (2023) | CNBC via NBC New York |
Read that table twice. The first four rows are about attention. They tell you how fast a video or a trend burns. The last row is about a product. And that gap is the whole problem with the question "how long do TikTok trends last."
A trend and a product aren't the same animal.
The Socialinsider dataset is big (6 million posts from 72,000 accounts, January to August 2025), and it says a video does most of its work in the first five days, then settles into a slower tail across 20 to 30 days. A trend is a pile of those videos. When creators stop making new ones, the pile stops growing.
But a product can outlive the trend that launched it. People keep searching for it. They buy the refill. They tell a friend. That second life never shows up in view counts, which is why view counts are the wrong thing to track.
Why does the viral product lifecycle matter more than the views?
Because you don't sell views. You sell units, and units need lead time.
Here's the math that burns founders. Say a supplier needs 21 days to get stock to you. The product you spotted on Monday is part of the "nearly half" that fades within five days. Your boxes land on day 21. The buyers left on day 5.
You didn't buy inventory. You bought a storage bill.
I get the pull. When you see a product doing numbers on the For You page, it feels like money lying on the sidewalk. The comments say "where do I buy this" 400 times. The creator's link is sold out. Every instinct says move now.
But here's the thing. The comment section at the peak is the loudest it will ever be. It's also the worst moment to make a buying decision, because you're looking at the top of the curve and calling it the average.
A viral peak isn't a forecast. It's the high-water mark, and you're standing at it.
The fix isn't "never chase trends." Some of them are worth it. The fix is to stop guessing and start measuring the one number that decides everything: how many days it takes demand to fall to half of its peak.
What does the 90-day tracking study measure?
This is the study design. Run it on a shortlist of products before you commit real money, and keep running it on anything you already sell that took off on TikTok.
The shortlist
Pick 12 products. Eight trend candidates you spotted on TikTok in the last two weeks, plus four controls: steady sellers from your own catalog that never went viral. The controls matter. Without them you can't tell a TikTok decline from a normal seasonal dip in your category.
If you want a faster way to build the candidate list, the free spotter tool pulls the videos getting the most views in a niche right now.
The three signals
Track each product on three signals at the same time. One signal lies. Three rarely agree by accident.
- Search interest. Google Trends for the product's plain name ("cloud slides," not the brand). Google says the data is a sample of searches, scaled from 0 to 100 based on the topic's share of all searches. That scaling changes with the date range you pick, so always pull the full window from day zero to today in one go, and re-pull the whole series each week instead of pasting new weeks onto old ones.
- Creator supply. The number of new TikTok videos about the product each week. Count them by hand from search results if you have to. This is the signal that dies first, because it's the one the Publicis numbers describe.
- Your own demand. Sessions, orders, conversion rate and average order value on the product page, weekly. If you don't sell it yet, run a small test page and a small ad budget against it for the first two weeks. Your store is the only signal you fully own.
Day zero and the peak
Day zero is the day you add the product to the tracker. The peak is the highest 7-day average of each signal during the 90 days. You'll only know the peak for sure looking backward, which is the point. A product can peak on day 3 or day 60, and the two call for very different moves.
The weekly log
Here's the sheet. One row per product per week.
| Column | What goes in it | Why it matters |
|---|---|---|
| Week | 1 to 13 | 13 weeks covers the full 90 days |
| Search index | Google Trends value, 7-day average | Is interest spreading past TikTok? |
| New creator videos | Count for the week | Is the trend still being fed? |
| Page sessions | From Shopify analytics | Your real share of the attention |
| Conversion rate | Orders divided by sessions | Is the page closing the traffic it gets? |
| Average order value | Revenue divided by orders | Are buyers adding more than one unit? |
| Revenue per visitor | Conversion rate times average order value | The number that decides if the traffic is worth buying |
| Cost per purchase | Ad spend divided by orders | Tells you when paid traffic stops paying |
| Comment mix | Share of comments asking to buy | An early warning, more on that below |
The four numbers you compute at the end
- T50: days from the peak until the 7-day average falls below 50% of peak. This is the headline number.
- T25: days from the peak to 25% of peak. Tells you how steep the slide is.
- Floor ratio: the day-90 value divided by the peak. A product that sits at 40% of peak on day 90 is a product. One that sits at 3% was a moment.
- Lead-time gap: T50 minus your supplier lead time in days. Negative means your stock lands after half the demand is gone.
That last one is the decision number. Everything else is context.
What does a trend decline chart look like?
Below is the chart this study produces. The numbers are hypothetical, made up to show you how to read your own tracker once it fills in. They are not measured results from any store.
Illustrative numbers only, not measured data. Run the 90-day study to get your own.
Watch what happens when you lay your supplier lead time over a chart like that.
If your lead time is 21 days, the first two bars are off the table. Their T50 lands before your stock does. The seasonal piece is a coin flip. The last two are the only ones where inventory arrives while demand is still above half of peak.
That's the whole study in one picture. You aren't asking "is this product hot?" You're asking "is it still going to be hot when my boxes show up?"
The four buckets I sort products into
These are my working buckets for reading the results. They're a framework, not findings.
| Bucket | T50 | Floor at day 90 | What to do |
|---|---|---|---|
| Flash | 7 days or less | Near zero | Don't buy stock. Sell only if you already have it on hand. |
| Wave | 8 to 30 days | Under 15% of peak | Small order, fast freight, exit plan on day one. |
| Swell | 31 to 89 days | 15% to 40% of peak | Real order. Build a proper page. Watch search interest. |
| Staple | Never falls below 50% | Above 40% of peak | Treat it like a catalog product. Invest in the page and the offer. |
If most of your shortlist lands in Flash and Wave, that isn't a failure of the study. That's the Publicis finding showing up in your own data, and it just saved you an inventory order.
Which TikTok trending products hold, and why?
Here I have to be careful, because this is where most articles on TikTok trending products start inventing things. I'll give you one published case, then the hypotheses your study is built to test.
The published case: a cup that held for years
The Stanley Quencher is the product everyone points to, and the history is more useful than the hype. According to CNBC's reporting, the cup launched in 2016. By 2019 sales were weak enough that Stanley had stopped restocking and marketing it. A commerce blog called The Buy Guide kept pushing it, placed a 5,000-unit wholesale order, and sold out within days. After a leadership change in 2020 the company leaned in, and Stanley's revenue went from $73 million in 2019 to a projected $750 million in 2023.
That's roughly ten times in four years. From a product the company had nearly given up on.
Two things jump out. First, the product had a dormant life before the spike, so the viral moment didn't create the demand, it exposed it. Second, it's a daily-use item. You carry it every day. That's a very different animal from a gadget you show a friend once.
The hypotheses your 90-day study tests
These are what I'd expect to separate a Swell or Staple from a Flash. Treat them as questions your tracker answers, not as rules.
- Daily use beats one-time wow. Products tied to a routine (hydration, skincare, sleep, cleaning) should hold a higher floor than novelty items.
- Consumables beat one-offs. If the product runs out, there's a second purchase built in after the videos stop.
- Many creators beat one creator. A trend carried by 300 small accounts is spreading. A trend carried by one big account is a single ad that happened to be free.
- Search keeps climbing after videos cool. If Google interest rises in the weeks after creator supply peaks, buyers are looking for it on their own. That's the strongest sign I know of that a product has a second life.
- Buying questions beat jokes. A comment section full of "which size do I get" is a market. A comment section full of laughing emojis is an audience.
Your controls are how you check yourself here. If your "steady" products drop just as hard in the same weeks, the decline you're seeing is your category, not TikTok.
Where does AI fit into tracking TikTok made me buy it trends?
Two places, and both are practical today.
Reading comments at scale. The fifth hypothesis above needs you to sort hundreds of comments a week into "wants to buy," "has a question," "joking," and "complaint." That's tedious by hand and quick for an AI assistant. Paste in the comments, ask it to count each type and pull out the exact buying questions word for word. Log the share of buying comments each week. If it drops while views still look healthy, you've probably found the peak a week before the view counts admit it. (That's a hypothesis to test in your own tracker, not a proven rule.)
Getting a page live while the window is open. This is the one founders underestimate. If a product's T50 is 23 days and it takes you three weeks to get a designer, a copywriter and a developer to build the page, you've spent the entire useful life of the trend on setup. At RevenueFlows AI we build high-converting product pages in less than 15 minutes, which turns the page from a three-week project into something you can have live the same day you spot the product.
And that second point leads straight into the part of this study that matters most.
What happens to your revenue when the trend fades?
Everyone tracks the traffic. Almost nobody tracks what each visitor is worth. So let's run the math on a store like this, a hypothetical.
A posture corrector goes viral. At peak week, the store gets 40,000 visitors to the product page. The page is a spec sheet: three bullets, a size chart, a price. Conversion rate 1.2%, average order value $34. That means revenue per visitor is $0.408. On 40,000 visitors that's $16,320 for the week.
Then the trend does what the Publicis data says most trends do. Two weeks later, traffic is down 50%, to 20,000 visitors. Same page. Conversion rate 1.2%, average order value $34, revenue per visitor $0.408. On 20,000 visitors that's $8,160.
That's the week most founders call the trend "dead" and move on.
Now watch this. Same half-dead trend, same 20,000 visitors, but the page answers the buyer's real question ("will this actually fix my slouch, or is it another thing in a drawer?") and offers a two-pack for a partner. Conversion rate goes to 2.4%, average order value to $51. Revenue per visitor is $1.224. On 20,000 visitors that's $24,480.
Hypothetical store. Visitors x conversion rate x average order value.
Read that again. The rebuilt page on half the traffic outearns the old page at the very top of the trend. Both weeks produce exactly 480 orders. The difference is $17 more per order and a page that closes twice as often.
Chasing the next spike is renting attention. Fixing the page is owning what the attention is worth.
That's the polarity this whole post is built on. Most founders treat a TikTok trend like a lottery ticket and the page like an afterthought. Flip it. The trend is out of your control. The page is the only part of the viral product lifecycle you fully own, and it's the part that keeps paying after the videos stop.
Plug your own numbers in and see where your page sits.
This isn't only a hypothetical lever
Here's a real one. A bedding brand we worked with moved from a conversion rate of 1.0% and an average order value of $125 (revenue per visitor $1.25) to a conversion rate of 3.5% and an average order value of $231 (revenue per visitor $8.10). On 10,000 visitors, that's $12,500 before and $81,000 after, from the same traffic. See the full before and after numbers on our results page. Real client numbers, not typical results, and not a promise of what your store will do.
That brand didn't need a new trend. It needed each visitor to be worth more. If you're running a TikTok product, that's the lever that stretches a Wave into something closer to a Swell, because a page that closes at 3% can afford paid traffic long after one that closes at 1% has to stop.
How should you read the results of your own study?
Once your 13 weekly rows are in, run through these in order.
Start with the lead-time gap. For every product, T50 minus supplier lead time. Anything negative gets no bulk order. That one rule would have saved a lot of founders a lot of dead stock.
Then look at the floor. A product with a T50 of 14 days and a floor of 35% at day 90 is a better business than one with a T50 of 30 days and a floor of 4%. Fast decline to a high floor means the trend faded but the product stuck. That's the Stanley shape.
Then compare your page numbers across weeks. If conversion rate drops as traffic falls, that's normal: the late visitors are less excited than the early ones. But if revenue per visitor falls off a cliff at the same time, the page was riding the hype instead of selling the product. Fix the page before you judge the product.
Then check your controls. If the four steady sellers dipped in the same weeks, some of what you measured is seasonality. Adjust before you draw a conclusion.
Finally, write down your call. Flash, Wave, Swell or Staple, with the date. In 90 days, run the tracker again on the survivors. The second pass is where you learn whether your gut is any good at this. Mine isn't as good as I'd like. That's exactly why I trust the tracker over the For You page.
What do the big TikTok Shop numbers leave out?
You'll see headlines that make every trend feel like a gold rush. Some of them are real. Beauty sales on TikTok Shop in the US hit $928.5 million in the first quarter of 2026, up 96% from $473.6 million a year earlier, according to Charm.io data reported by Beauty Independent.
That number is true. It's also a category total. It tells you the river is getting bigger. It doesn't tell you how long any single product floats on it.
A category can double while nearly three in four of the individual trends inside it fade inside two weeks. Both things are true at once. That's exactly why product-level tracking matters: the category chart will always look better than your SKU's chart.
So when someone shows you a growth number to sell you on chasing TikTok trending products, ask one question. "Is that the category or the product?" If it's the category, you still need your own 90 days.
Is chasing TikTok trends worth it for a Shopify brand?
Here's my honest take after watching this from the founder side for years.
Chasing trends as a strategy is a treadmill. You're always buying at the peak, always racing a lead time, always one product away from the one that sticks. The Publicis numbers say most of your races are lost before they start.
But tracking trends as research is worth it. A 90-day tracker on 12 products costs you a spreadsheet and 30 minutes a week. What it buys you:
- A list of products that fail fast, which you never stock.
- A shortlist of Swells and Staples that are worth a real inventory order.
- A clear read on whether your own page closes TikTok traffic or leaks it.
And if you already have a product that took off, the study tells you something even more useful: how much runway you have left, and how much of it you're wasting on a page that converts at 1%.
You can't control how long a trend lasts. You can control whether your page is ready for it.
Frequently asked questions
How long do TikTok viral products stay popular?
Most don't stay popular for long. Publicis Groupe APAC found nearly half of TikTok trends disappear within five days, and only 27% stay relevant past two weeks. A small group of products tied to everyday routines hold for months or years, so measure your own product's decline instead of guessing.
What is the viral product lifecycle on TikTok?
It runs spike, peak, decline, floor. Views surge in the first few days, a peak hits, and demand slides toward a floor. The two numbers that matter are the days it takes to fall to half of peak (T50) and how high the floor sits at day 90.
Are TikTok made me buy it trends worth chasing?
Only when your supplier lead time is shorter than the product's T50. If stock takes 21 days and demand halves in 7, your inventory lands after most buyers have moved on. Chase the ones still above half of peak demand after a month.
How do I tell a TikTok fad from a lasting trend?
Track three signals for 90 days: Google search interest, new creator videos per week and your own orders. Fads drop below half of peak inside two weeks and flatline near zero. Products that last keep a floor, and search interest often keeps climbing after the videos cool.
Which TikTok trending products last the longest?
Products tied to a daily habit tend to outlast novelty items. The Stanley Quencher is the clearest published example: launched in 2016, nearly dropped by 2019, and then part of a run that took Stanley from $73 million in 2019 revenue to a projected $750 million in 2023.
What to do next
Open a blank sheet today and set up the weekly log from the table above, with one row for the TikTok product you're most tempted to stock right now. Write its supplier lead time in the first cell. Check it every Monday for 13 weeks before you place a bulk order.
If you already sell something that took off on TikTok, skip the waiting. Pull last month's sessions, conversion rate and average order value for that product page, and work out what each visitor is worth. If you're under $1.00, the trend isn't your problem. The page is. For more on that side of it, read how to write a Shopify product page for TikTok traffic, then compare yourself against the 2026 Shopify conversion rate benchmarks. If the page gets clicks and no orders, this breakdown of Shopify traffic with no sales is where to start. And the library of ecommerce case studies shows what the before and after looks like with every input on the table.
Book Your Profit Audit
A TikTok trend gives you a few weeks of attention, and the page decides how much of it turns into money. Book a profit audit and we'll show you what each visitor on your viral product is worth right now, then how to rebuild a high-converting product sales page in less than 15 minutes.
Or go here to check it out → revenueflows.ai
P.S. Nearly half of TikTok trends are gone in five days. The page you build during those five days is the part that's still selling on day 90.
Frequently asked questions
How long do TikTok viral products stay popular?
Most don't last long. A Publicis Groupe APAC study found nearly half of TikTok trends disappear within five days and only 27% stay relevant beyond two weeks. A small group of products tied to daily routines hold for months or years, so measure your product's decline instead of guessing.
What is the viral product lifecycle on TikTok?
It usually runs spike, peak, decline, floor. Views surge in the first days, a peak hits, and demand drops toward a floor. The number that matters is how many days it takes to fall to half of peak demand, and how high the floor sits at day 90.
Are TikTok made me buy it trends worth chasing?
Only when your inventory lead time is shorter than the product's decline. If a supplier needs 21 days and the trend loses half its demand in 7, your stock lands after the party. The trends worth chasing are the ones that still sit above half of peak demand after a month.
How do I tell a TikTok fad from a lasting trend?
Track it for 90 days on three signals at once: Google search interest, new creator posts per week, and your own orders. Fads fall below half of peak inside two weeks and flatline near zero. Products that hold keep a floor, and search interest keeps rising after the videos cool off.
Which TikTok trending products last the longest?
Products tied to an everyday habit tend to hold longer than novelty items. The Stanley Quencher is the clearest published example: a cup launched in 2016 that helped take Stanley from $73 million in 2019 revenue to a projected $750 million in 2023.