
Does Local Currency Increase Shopify Conversion Rate?
The published claims for local currency display run from 30% to 581%. The most rigorously measured number in the same space is 7.4%. Both are real. They count different things, and almost nobody says which.

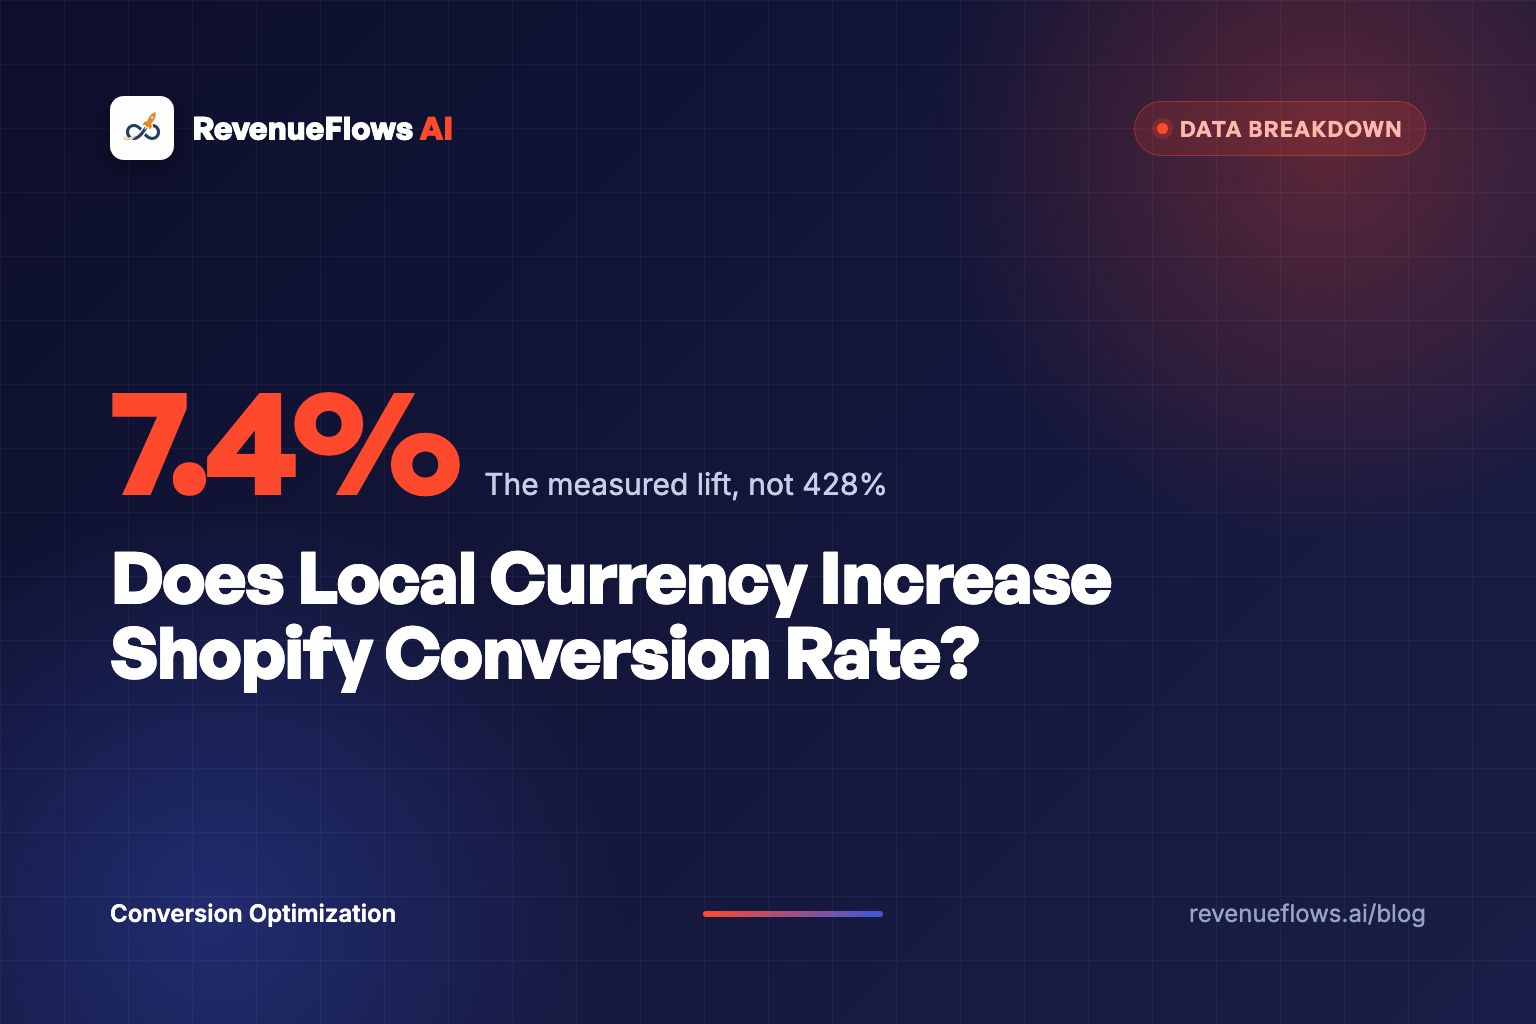
Does showing local currency increase Shopify conversion rate? Yes, and by a fraction of what you have been told. The honest expectation is a single digit relative lift on your international traffic. The figures in circulation run from 30% to 581%, and they come almost entirely from companies that sell currency conversion tools, measured against international baselines so small that a dozen extra orders produce a triple digit percentage.
Both sets of numbers are real. They differ by roughly 50x because they count different things, and almost nobody quoting them says which.
That's what this breakdown is about. The published figures laid side by side with what each one actually measured, the arithmetic that reconciles them, what a currency toggle is worth per visitor on your own store, and the six situations where currency display genuinely is the thing standing between you and the order.
Local currency display removes a disqualifier. It does not add a reason to buy. Those are different jobs, and only one of them pays.
What do the published local currency numbers actually say?
Here is every figure I could find with a traceable source, next to what it was really measuring.
| Published figure | What it's usually presented as | What it actually measures | Who benefits from the claim |
|---|---|---|---|
| "Up to 40% conversion increase" | The effect of showing familiar price formats | A ceiling, not an average. "Up to" is doing all the work | Currency and localization app vendors |
| "Up to 30% boost" | Local currency lift across businesses | An upper bound across mixed localization changes | Multi-currency tool marketing |
| 428% Germany, 397% Saudi Arabia, 581% UK | One jewelry brand's conversion lift from familiar pricing | Relative lift from a near zero baseline, absolute rates not published | The platform that ran the case study |
| 92% of shoppers prefer local currency | Proof that currency drives purchases | A stated survey preference, not observed buying behavior | Survey sponsor |
| 33% abandon rather than convert currency | A direct abandonment cause | Self reported intent in a survey, not measured cart data | Survey sponsor |
| 68% of international customers lost to unfamiliar symbols | Revenue you're losing right now | An unsourced round figure repeated across vendor blogs | Everyone selling the fix |
| 7.4% average conversion increase | Adding relevant local payment methods | Observed conversion data across Stripe's merchant base | Stripe, which also sells the fix, but publishes the method |
| 12% revenue lift | Expanded payment options | Same dataset as above | Stripe |
| 91% conversion increase in China | Offering Alipay | A single market with a dominant local wallet | Stripe |
Read the right hand column twice. Seven of the nine numbers are either survey-stated preference, an "up to" ceiling, or a percentage lift with the baseline withheld.
The two that survive contact with a skeptic are Stripe's 7.4% and the 91% China figure, and both of them are measuring something broader than a currency symbol. They're measuring payment method localization, which is a bigger change: it's the difference between a German buyer seeing a familiar wallet at checkout and seeing three card logos they don't use.
So the strongest available evidence for currency display is a number that was earned by something more than currency display. Keep that in your pocket.
Why do the vendor numbers and the measured numbers disagree by 50x?
Because of the denominator. It's always the denominator.
Take the jewelry case study, the strongest looking number in the table. A 428% conversion lift in Germany. That sounds like the single biggest change any store could make.
Now put plausible numbers underneath it. Suppose German traffic was converting at 0.1%, which is what a lot of stores see when a market is being served an unlocalized page. A 428% relative lift takes 0.1% to roughly 0.53%.
That's the whole story. The store went from converting one in a thousand German visitors to converting five in a thousand. It's a genuine improvement, it is correctly described as 428%, and the page is still converting at a rate that would be considered broken in the domestic market.
A 428% lift from 0.1% to 0.53% is arithmetic, not a case study. Always ask for the two conversion rates, never the multiplier.
Now run it the other direction. Take a store already converting international traffic at 0.4%, because the page is decent and only the currency is wrong. Apply the honest 7.4%. You land at 0.43%. Nobody writes a case study about 0.43%.
This is the pattern behind almost every inflated conversion claim in ecommerce, and it's the same one we worked through in the back in stock alerts breakdown, where a 6.46% measured recovery rate is marketed as 25% to 35%. Different tactic, identical trick: quote the multiplier, hide the base.
There's a second distortion worth naming. Surveys measure what people say. Checkouts measure what people do. When 92% of shoppers say they prefer local currency, that's true and it's roughly as actionable as 92% of people preferring free shipping. Preference is not a purchase decision. It's a tiebreaker that only matters once everything expensive has already been decided.
What does a currency toggle actually do for a buyer?
It removes a reason to leave. That's the entire function, and it's worth understanding precisely, because it explains the size of the effect.
Picture a buyer in Manchester landing on a US store selling a $180 leather bag. The price says $180. Her internal process runs like this: is that dollars, roughly £140, will my card add a fee, will customs bill me at the door, and how much is shipping.
Turning on local currency answers exactly one of those four questions. She now sees £142 instead of $180. The card fee question, the customs question and the shipping question are all still open, and those three are the ones attached to real money she can't predict.
This is why the effect is small and why it's still worth having. You've moved her from four unknowns to three. You have not given her a reason to buy the bag.
And the unresolved three are the expensive ones. Baymard Institute's cart abandonment research puts unexpected extra costs, meaning shipping, taxes and duties, as the most common abandonment reason, against an overall abandonment rate of roughly 70%. Baymard's survey work also finds 18% of international shoppers citing a complicated checkout as a primary reason they quit.
Currency confusion sits inside that picture. It's real, and it's a supporting character.
| The international buyer's four questions | Does local currency answer it? | What does answer it |
|---|---|---|
| What is this in my money? | Yes | Presentment currency |
| Will my bank add a conversion fee? | No | Charging in her currency, not just displaying it |
| Will customs bill me on delivery? | No | Duties paid at checkout, stated on the page |
| What's shipping to my address? | No | A real rate shown before the cart |
Three of the four are landed cost problems. A store that turns on multi-currency and stops has answered the cheapest question on the list.
What is the currency toggle worth on your store?
Let's put actual money on it. Run the math on a store like this.
Ten thousand international visitors a month. Conversion rate 0.4%. Average order value $90. Revenue per visitor is $0.36, which is $3,600 a month from that segment.
Scenario one: turn on local currency. Apply the 7.4% relative lift, which is generous, because that number was earned by adding local payment methods and not by changing a currency symbol. Conversion rate moves to roughly 0.43%. Revenue per visitor $0.39. That's $3,870 on the same 10,000 visitors.
You gained $270 a month.
Scenario two: believe the marketing. Apply the "up to 40%" ceiling. Conversion rate goes to 0.56%. Revenue per visitor $0.50. That's $5,040, a gain of $1,440 a month.
Scenario three: fix the page. Rewrite the product page so it answers the landed cost questions, sells to a buyer who has never heard of your brand, and attaches the right second item. Conversion rate 1.4%, average order value $125. Revenue per visitor $1.75, which is $17,500 on the same 10,000 visitors.
You gained $13,900 a month.
| Scenario | Conversion rate | Average order value | Revenue per visitor | Monthly on 10,000 | Gain |
|---|---|---|---|---|---|
| Today | 0.4% | $90 | $0.36 | $3,600 | baseline |
| Local currency, honest lift | 0.43% | $90 | $0.39 | $3,870 | +$270 |
| Local currency, vendor claim | 0.56% | $90 | $0.50 | $5,040 | +$1,440 |
| Page rebuilt | 1.4% | $125 | $1.75 | $17,500 | +$13,900 |
The page is worth about 51 times the currency toggle. And notice the column that never moves in the first three rows: average order value. Revenue per visitor is conversion rate multiplied by average order value, and a currency symbol can only ever touch one of those two numbers, slightly.
Turn multi-currency on. It takes an afternoon and it costs nothing. Then stop calling it a growth plan.
For what happens when both numbers move together, our bedding client went from conversion rate 1.0% and average order value $125, which is revenue per visitor of $1.25, to conversion rate 3.5% and average order value $231, which is revenue per visitor of $8.10. On 10,000 visitors that's $81,000 instead of $12,500, a gap of $68,500. You can see the full case study numbers. Real client numbers, not typical results, and not a promise of what your store will do.
When is local currency the thing actually blocking the sale?
There are real cases. Six of them, and they're specific enough that you'll know within a minute whether you're in one.
1. Your international conversion rate is under 0.2%. At that level something structural is broken, and currency is one of the cheapest structural things to check first. This is the situation the 400% case studies come from. If that's you, the case studies are about your store and you should act on them.
2. You sell high consideration items above $300. The bigger the number, the more work the buyer does converting it in their head, and the more a wrong-looking price becomes a reason to open a competitor tab. This compounds with everything in the high ticket product page guide.
3. Your traffic concentrates in one non-domestic market. A store where 40% of sessions come from the UK is a different problem from a store with visitors from sixty countries. One market means you can localize properly: currency, spelling, sizing, shipping promise, the lot.
4. You're in a category with strong local price anchors. Jewelry, apparel and beauty buyers know what things cost in their own currency. A price they can't place reads as suspicious rather than merely foreign, which is why the effect shows up hardest in categories like jewelry.
5. Your prices land on awkward converted numbers. $180 becoming £141.73 looks like a machine did it. £145 looks like a price. Presentment rounding rules matter more than presentment currency, and most stores turn on the first without configuring the second.
6. You're charging in the buyer's currency, not just displaying it. This is the one that actually earns the Stripe style numbers, because it removes the bank conversion fee rather than just relabeling the price. Display alone leaves the fee in place, and a buyer who has been surprised by a foreign transaction charge before is watching for it.
Outside those six, currency display is hygiene. Do it, then move on.
What should you do instead, in order?
If your international segment is underperforming and you want the sequence that actually pays, it goes like this.
First, show landed cost. Duties and taxes calculated and charged at checkout, with a plain line on the product page saying so. This attacks Baymard's number one abandonment cause directly, and no currency setting touches it. "Price includes UK duties and VAT. No charges on delivery." is one sentence and it outperforms every localization feature you could buy.
Second, charge in their currency, don't merely display it. Shopify Markets supports this natively. Display removes confusion; charging removes a fee. Only one of those is money.
Third, add the local payment method. This is where Stripe's 7.4% actually lives, and in some markets it's the whole game. The 91% China figure is not a currency story, it's a wallet story.
Fourth, rewrite the page for a buyer who has never heard of you. International traffic is usually colder than domestic traffic, arriving through search and social rather than through your brand. That's a copy problem, and it's the one worth the most, as broken down in writing a product page for international buyers.
Notice the order. Three logistics fixes and one copy fix, and the copy fix is last only because the first three are faster. In dollar terms it's first, by a distance.
Where these numbers came from
So this can be checked rather than trusted.
The 7.4% conversion increase, the 12% revenue lift and the 91% China figure are Stripe's published payment localization guidance, drawn from observed merchant data. The 70% cart abandonment average and the finding that unexpected extra costs lead abandonment reasons are Baymard Institute's ongoing cart abandonment research. The 18% international checkout complexity figure comes from Baymard survey work cited in cross-border commerce reporting.
The 30%, 40%, 92%, 33% and 68% figures come from vendor blogs and localization tool marketing where the underlying methodology is not published. The 428%, 397% and 581% market lifts come from a single jewelry brand case study distributed by a geotargeting platform, with the underlying conversion rates not disclosed. I've included them because they're what you'll find when you search this question, not because they should change your decision.
Where I've run scenarios in this piece, the store is hypothetical and labeled as such. The bedding numbers are a real client and are linked to the case study.
What to do next
Open Shopify analytics and filter sessions to your top non-domestic market. Find two numbers: the conversion rate for that market, and your domestic conversion rate.
If the international number is under 0.2%, turn on multi-currency this week, then keep reading this list.
If it's already above 0.4%, currency is worth about $270 a month to you, and the $13,900 is sitting in the page.
We'll find which one you're in, for free. Book a profit audit and we'll show you exactly where your revenue per visitor is leaking, then rebuild a high converting product sales page in less than 15 minutes so a visitor from any country gets a page that answers the four questions instead of one of them.
Frequently asked questions
Does showing local currency increase Shopify conversion rate?
Yes, but far less than the marketing numbers suggest. Local currency display removes a disqualifier rather than adding a reason to buy, so the honest expectation is a single digit relative lift on your international segment, in line with the roughly 7.4% average conversion increase Stripe reports for adding relevant local payment methods. The 30% to 581% figures in circulation come from vendors selling currency tools, measured on tiny international baselines where a handful of extra orders produces a huge percentage.
Why do local currency case studies show 400% and 500% conversion lifts?
Because the starting number was close to zero. A store converting German traffic at 0.1% that moves to 0.53% has posted a 428% lift and is still converting worse than almost any domestic page. Percentage lifts on tiny baselines are mathematically true and commercially meaningless, which is why you should always ask for the before and after conversion rates rather than the multiplier.
What actually stops international shoppers from buying?
Landed cost, not currency symbols. Baymard Institute's cart abandonment research puts unexpected extra costs, meaning shipping, taxes and duties, as the single most common reason shoppers abandon, and around 70% of carts are abandoned overall. An international buyer who sees a price in their own currency and still can't tell whether customs will bill them at the door has learned nothing useful.
Is multi-currency worth turning on if the lift is small?
Yes, because it is nearly free and it is table stakes. Shopify Markets handles presentment currency natively, so the cost is configuration time rather than development. Treat it as a floor you have to stand on, not a growth lever you can pull, and put your actual effort into the page.
What is worth more, local currency or rewriting the product page?
The page, by a wide margin. On a store sending 10,000 international visitors a month at 0.4% conversion and a $90 average order value, revenue per visitor is $0.36, which is $3,600. A generous currency lift moves that to about $3,870. Rebuilding the page to 1.4% conversion and a $125 average order value moves it to $17,500. The currency toggle is worth $270 a month and the page is worth $13,900.
Does local currency display raise average order value?
No. Currency presentation changes how a price is read, not how much is in the cart. Since revenue per visitor is conversion rate multiplied by average order value, a currency toggle can only ever move one half of the equation, and only slightly. Anything that claims to lift both is describing a broader localization program, not a currency setting.