
Does Cost Per Use Increase Shopify Conversion Rate?
The pennies-a-day research is 40 years old and holds up. What nobody has published is the Shopify version, and the threshold where the same sentence starts costing you money.

Short answer: on higher priced products with a countable lifespan, yes, and the effect is well documented outside ecommerce. On cheap products it can move your conversion rate the wrong way.
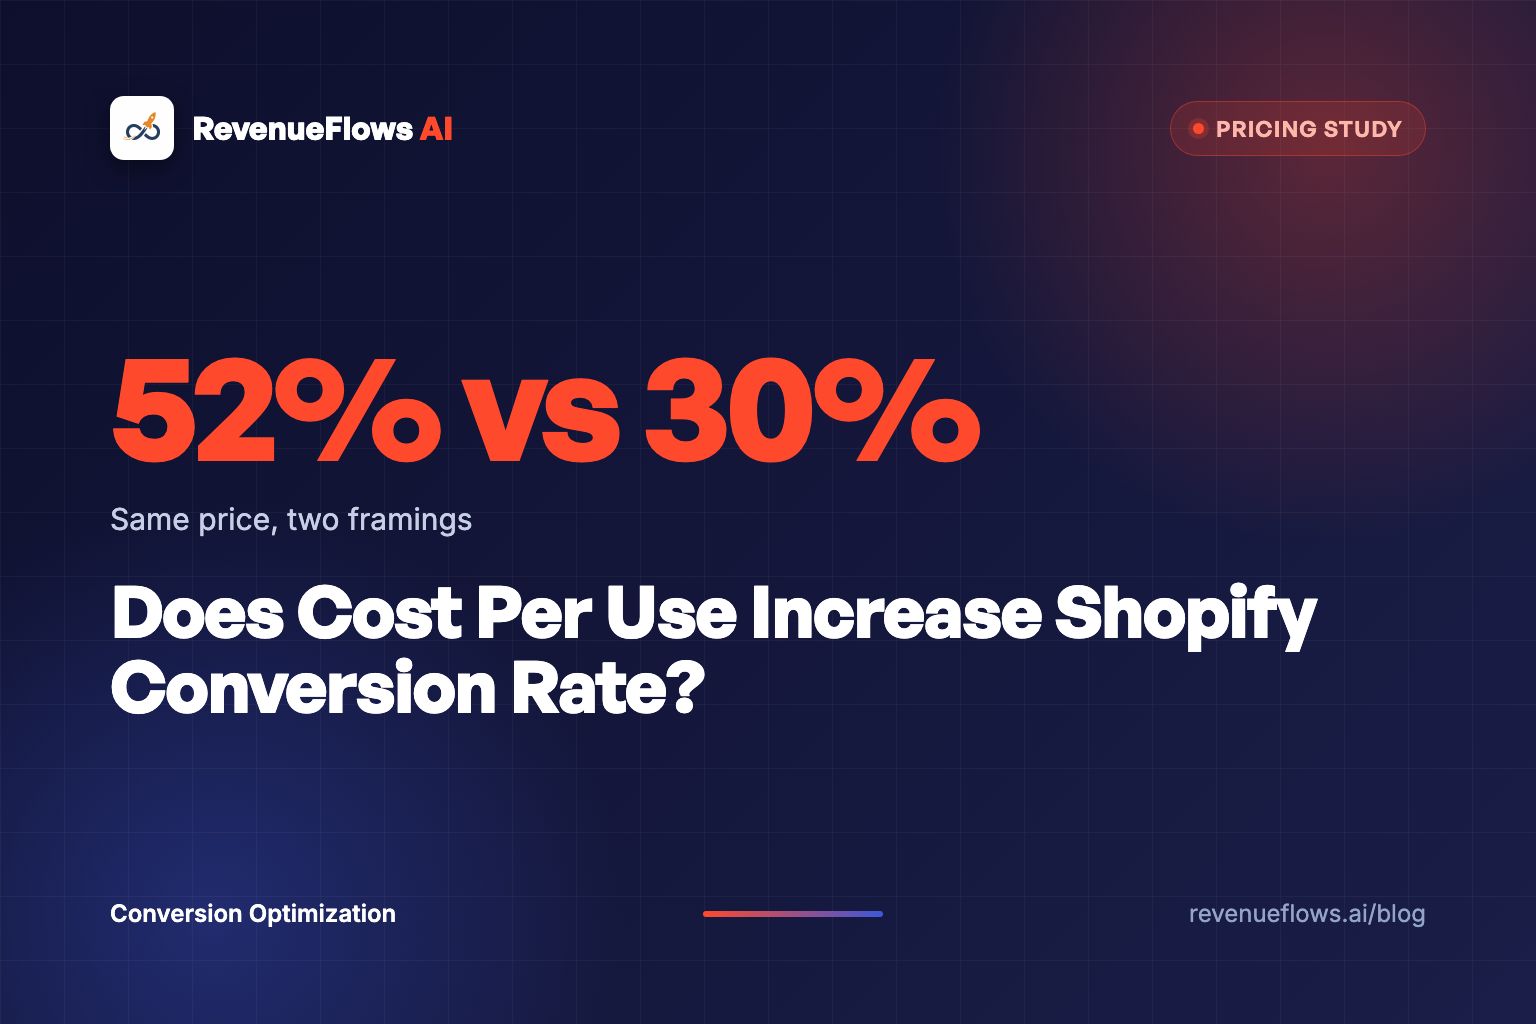
Here's the cleanest number in the whole literature. When a charity asked people for "an ongoing contribution of 85 cents per day," 52% said yes. When the same charity asked for "a total contribution of $300 per year," 30% said yes. Identical money. A 22 point gap in acceptance, purely from how the number was cut. That finding is reported in Psychology Today's summary of the pennies-a-day research, which also documents magazine publishers testing per-issue against per-year pricing and finding the per-issue framing 10% to 40% more effective at winning new subscribers.
So the mechanism is real and it's forty years old. What nobody has published is the Shopify version, with a control page, a treatment page, and a conversion rate on each. I went looking for it. It doesn't exist in public.
This post is what to do with that gap: what the adjacent evidence supports, where the framing breaks, how to calculate the number without getting caught, and how to run the test on your own store so you're deciding from your data instead of someone's blog post.
Cost per use doesn't change what the buyer pays. It changes what the buyer is comparing the price to, which is the entire game.
What does the research on price reframing actually show?
Three findings that keep replicating, and one honest limit.
Finding one: per-period framing beats lump sum on the same money. The magazine subscription tests are the longest running evidence base here. Publishers moved to quoting per-issue prices in the early 1980s and kept the practice because response rates favored it consistently, in the range of 10% to 40% better than the annual figure. These are direct mail and subscription tests, not Shopify split tests, and they involve a commitment structure most product pages don't have. Read them as a strong signal about human pricing perception, not as a number you can copy onto your store's forecast.
Finding two: the effect comes from what the small number gets compared to. Consumer psychologists call this temporal reframing. Eighty-five cents a day doesn't get measured against other charitable gifts. It gets measured against a coffee, a bus fare, a candy bar, and it wins every one of those comparisons. Three hundred dollars a year gets measured against a flight. The price never moved. The reference class did.
Finding three: the framing has to be believable to survive contact. Shopify's own guide to psychological pricing puts the whole family of tactics under the same caution, which is that perceived value collapses the moment the buyer feels handled. A price reframe that gets caught doesn't return to neutral. It goes negative, because now every other claim on the page is suspect.
The honest limit: none of this was measured on a product page with a cart. Pricing test results are famously context dependent, and CXL's collection of pricing experiments is largely a catalog of tactics that won in one context and lost in another. Anyone quoting you a specific conversion rate lift for cost per use on Shopify is making it up.
Why does the same sentence help one page and hurt another?
Because dividing a price does two things at once, and only one of them is good for you.
It lowers the perceived size of the cost. That's the effect you want. It also lowers the perceived size of the decision, and that one cuts both directions depending on where you started.
On a $349 product, shrinking the decision is pure gain. The buyer was stuck on whether $349 is a lot of money. Reframing it as 96 cents a day for a year moves them from a budget question to a habit question, and habit questions get answered yes far more often than budget questions.
On a $29 product, the buyer was never stuck on the price. They were stuck on whether the product is worth doing anything about at all. Tell them it's 48 cents a use and you've confirmed their suspicion that this is a small, skippable, low-stakes purchase. Low ticket pages run on desire and momentum. Cost per use drains both.
Above a certain price, dividing the number makes the purchase easier. Below it, dividing the number makes the purchase forgettable.
Where's the line? I don't have a clean study to hand you and I'm not going to invent one. What I've watched across client catalogs is that the framing starts earning its place somewhere around the point where a buyer would naturally do the arithmetic themselves, which in most consumer categories sits north of $100. Test it on your own price points rather than trusting my rule of thumb or anyone else's.
Where does cost per use backfire?
Four failure modes, in the order I see them.
The lifespan is optimistic and the buyer knows it. You divided a $240 jacket by 300 wears to get 80 cents. Nobody wears a jacket 300 times. The buyer runs their own version of the math, gets a number three times higher, and now they're not evaluating the jacket, they're evaluating whether you're honest. Divide by a number you'd defend in a support email.
The divided number is too small to matter. Below roughly a dollar per use, on an already cheap product, the sentence stops helping. Four cents a wash is not a reason to buy. It's a reason to not think about it.
It invites a comparison you lose. Cost per use is a value argument, and value arguments pull the buyer toward the cheapest option in the category. If a competitor sells a worse version for half the price, you just handed the buyer the framework where they win. Only run this framing when your per-use number actually beats the alternatives, and check before you publish.
It collides with a subscription. If the page also carries a subscribe and save widget, you now have two competing pricing stories on one screen: a per-use cost and a per-month commitment. The buyer has to reconcile them, and reconciliation is friction. Pick one primary frame per page. There's a longer argument about the commitment objection in does subscribe and save increase Shopify conversion rate.
How do you calculate cost per use without getting caught?
Use a divisor the buyer can verify, and show your work.
The safest divisors are the ones printed on your own packaging or backed by your own data:
| Product type | Divisor to use | Divisor to avoid |
|---|---|---|
| Consumables | Servings or units in the pack | "Months of use" |
| Apparel | Wears at a stated frequency, like twice a week for two years | Total lifetime wears |
| Appliances and tools | Warranty period, or median years to replacement | Manufacturer's rated hours |
| Filters and refills | Replacement interval on the label | Best case interval |
| Subscriptions | Billing period, stated as both monthly and per use | Per day, when billing is annual |
Then state the divisor in the same sentence as the number. Not "just 63 cents a day." Instead: "$189 for a 90 day supply, which works out to $2.10 a day." The second version survives scrutiny because the buyer can check it in their head, and a claim a buyer verifies is a claim that buys you trust for the rest of the page.
One more rule. Never round in your favor. A buyer who divides and gets a bigger number than the one you printed has caught you, and the sale is over.
Which categories gain the most from this?
The ones where the buyer is already doing the division silently.
Consumables and refills. The buyer opens two tabs and compares cost per serving whether you print it or not. Printing it means the comparison happens on your terms, with your best pack size. This is the whole reason the number belongs on refill ladders, which I covered in how to write a Shopify product page for consumable products.
High ticket durables with a long tail. Appliances, tools, mattresses, furniture. A $600 purchase amortized over eight years is a different conversation than a $600 purchase. Tool pages get a bonus here because the buyer is already thinking in platform terms, which is a fifteen-year commitment before you say a word. That's the backdrop for Shopify power tool product page optimization.
Products that replace a recurring expense. This is the strongest version of the whole tactic, because the comparison is external and concrete. An espresso machine that replaces a $5 daily coffee habit doesn't need pricing psychology, it needs arithmetic. Divide, compare, done. A Shopify espresso machine product page optimization that skips that comparison is leaving the easiest argument in the category on the floor.
Apparel, with care. Cost per wear has enough merchant demand that Shopify apps exist purely to compute it on product pages. That's a fair signal it works often enough to be worth productizing. It's also the category where optimistic divisors are most common and most easily caught.
Where it rarely helps: gifts, impulse buys, one-time-use products, and anything bought for an occasion rather than a routine. A wedding purchase has a use count of one, and saying so is not a selling point.
What happens to the math when the page shows cost per use
Picture two stores selling the same $189 ninety day supply of a dog joint supplement to the same cold traffic. This is a hypothetical, run the math on a store like this.
Before: conversion rate 1.5%, average order value $189. That means revenue per visitor is $2.84. On 10,000 visitors, that's $28,400.
Now the page prints one line under the price: "$189 for a 90 day supply, which works out to $2.10 a day." It also adds a two-pack at a lower cost per day. Conversion rate moves to 2.0%, because the buyer stopped comparing $189 against a $34 bottle from a marketplace and started comparing $2.10 a day against a vet visit. Average order value moves to $228, because the deeper rung on the ladder is now visible. Revenue per visitor is $4.56. On the same 10,000 visitors, that's $45,600.
Same traffic. Same supplement. $17,200 more, from one sentence and a second pack size.
Now the failure case, same hypothetical treatment applied where it doesn't belong. A $39 pack of laundry sheets, 60 washes, 65 cents a wash.
Before: conversion rate 2.2%, average order value $39. Revenue per visitor is $0.86. On 10,000 visitors, that's $8,600.
After adding the per-wash line: conversion rate 1.9%, average order value unchanged at $39. Revenue per visitor is $0.74. On the same 10,000 visitors, that's $7,400. The sentence cost the store $1,200 a month.
| High ticket supplement | Low ticket laundry sheets | |
|---|---|---|
| Price | $189 | $39 |
| Cost per use printed | $2.10 / day | $0.65 / wash |
| Conversion rate before | 1.5% | 2.2% |
| Conversion rate after | 2.0% | 1.9% |
| Average order value after | $228 | $39 |
| Revenue per visitor before | $2.84 | $0.86 |
| Revenue per visitor after | $4.56 | $0.74 |
| On 10,000 visitors | $28,400 to $45,600 | $8,600 to $7,400 |
Both of those are hypotheticals built to show the shape of the trade. For client numbers instead, see the full case study numbers on our results page: a bedding brand went from a 1.0% conversion rate and a $125 average order value, a revenue per visitor of $1.25, to a 3.5% conversion rate and a $231 average order value, a revenue per visitor of $8.10. On 10,000 visitors, $12,500 became $81,000. Real client numbers, not typical results, and not a promise of what your store will do.
A tactic with a real mechanism and a real failure mode is worth more than a tactic that always works, because you can actually decide where to point it.
Where should the number sit on the page?
Under the price, in smaller type, as a sentence.
Three placement rules that hold up:
- Adjacent to the price, always. The reframe only works while the buyer is looking at the original number. Two hundred pixels later they've already priced it in their head and moved on.
- A sentence, not a badge. Badges read as marketing. A plain line of text reads as information. The whole effect depends on being read as information.
- Repeat it once at the pack selector, never anywhere else. Once at the price, once where the buyer picks the size, and stop. Three appearances of the same reframe reads as a pitch.
And if you're running a comparison table on the page, the per-use figure belongs as a row in it rather than as separate copy, because that's where the buyer is already comparing. Tables also get lifted whole by AI search engines, which is a side benefit covered in do product comparison tables increase Shopify conversion rate.
How do you test this without fooling yourself?
Most stores testing pricing copy are measuring noise and calling it a result. Pricing copy is a page test, not a price test, and that matters when you pick a tool. I compare the two main Shopify testing apps in Shoplift vs Intelligems.
The discipline:
- Test on one product family at a time, not sitewide. The effect is price dependent, so pooling a $29 product and a $400 product averages a win and a loss into nothing.
- Run it long enough to clear a weekly cycle. Two full weeks minimum, because weekend and weekday buyers price differently.
- Measure revenue per visitor, not conversion rate. A per-use line that lifts conversion rate while pushing everyone to the smallest pack has lost you money. Conversion rate alone will hide that. If the metric isn't familiar, start with what is revenue per visitor.
- Watch returns for 60 days after. A framing that oversells lifespan converts today and refunds next month. The conversion test will show a win that the refund report erases.
- Keep one segment clean. Don't change the price, the images, and the framing in the same test window, which is how most stores end up with a result they can't attribute.
If you're on low traffic and a clean split test would take four months, don't run one. Print the honest number, watch the support inbox for people questioning it, and make the call on qualitative signal. That's a legitimate way to decide at low volume, and pretending otherwise is how small stores waste a quarter.
What about the credibility problem?
This is the part most pricing advice skips.
Cost per use has a reputational tail. There's a whole internet genre of mocking the arithmetic people use to justify purchases, and if your framing lands in that bucket, you've made your brand the punchline instead of the answer. The difference between a useful per-use figure and a joke is whether the divisor is defensible.
So a test I use before publishing any of these: would I be comfortable if a customer quoted this number back to me in a complaint email? "You said $2.10 a day and it ran out in 60 days" is a conversation that ends a customer relationship. "You said $2.10 a day and that's exactly what it was" is a conversation that never happens.
Publish numbers you'd defend. That's the whole rule, and it's the same rule that governs every other claim on a product page.
What are buyers already typing when they do this math?
Look at the searches and you can see the division happening in real time.
"How many washes in a bottle." "How long does a 30 serving tub last." "Is it cheaper than buying pods." "Cost per pod versus ground." These are not shopping queries in the normal sense. They're a person standing at the edge of a purchase, trying to build the divisor you refused to give them.
That's the practical argument for printing the number, separate from any psychology. Your page is competing with the buyer's own arithmetic, and their arithmetic is pessimistic, slow, and often done on a competitor's page because that page answered first.
Two things follow.
The first is that your product page should carry the divisor even if you decide against showing the finished per-use figure. Servings per container, wears per season, hours per charge, months per filter. The raw number is useful, non-promotional, and impossible to get caught on, because it's a fact rather than a claim.
The second is that the questions themselves are the copy. If four different buyers ask how many washes are in a bottle, that sentence belongs on the page in those words. Not translated into brand voice. In their words, because those are the words the next buyer is going to search.
How this post was assembled
Stating sources plainly, so the limits are visible.
The pennies-a-day evidence, including the 52% against 30% donation result and the 10% to 40% subscription range, comes from the Psychology Today summary of the temporal reframing literature linked above. The caution about perceived value collapsing under manipulation comes from Shopify's own psychological pricing guide. The observation that pricing test results rarely transfer between contexts comes from CXL's collection of pricing experiments.
The price threshold, the placement rules, and the failure modes come from work on client catalogs rather than from published research, and they're marked that way in the text. Every store figure in this post is a labeled hypothetical except the bedding brand numbers, which are client results linked to our results page with the standard caveat attached.
No published Shopify split test on cost per use framing was found during research for this post. If you have run one, that data would be worth more than everything above it.
Where this study stops
Four limits worth stating plainly, because a source that hides its limits doesn't deserve to be cited.
The core evidence is from subscription and donation contexts, not from ecommerce product pages. The magnitude of the effect on a Shopify page is unknown, and I've seen no credible published split test. The price threshold where the framing flips from helpful to harmful is drawn from what I've watched on client catalogs, not from controlled research, so treat it as a starting hypothesis for your own test. And every store math figure in this post is labeled hypothetical for a reason.
What survives all four caveats: the mechanism is real, it's been documented for four decades, it's free to try, and it fails in a predictable direction you can watch for. That's a better risk profile than most page changes anyone will sell you.
Divide the number. Then check whether you'd defend the divisor.
Book Your Profit Audit
If you're arguing internally about pricing copy, the faster move is finding out which page is actually leaking. Most stores are losing more to an unanswered question than to a pricing frame.
Get your free profit audit and we'll show you exactly where your revenue per visitor is leaking, then rebuild a high-converting product sales page in less than 15 minutes.
Frequently asked questions
Does showing cost per use increase conversion rate?
On higher priced products with a long or countable lifespan, the evidence says yes. Decades of temporal reframing research found per-period offers outperformed the equivalent lump sum by roughly 10% to 40% in subscription tests, and one donation study moved acceptance from 30% to 52% by quoting 85 cents a day instead of $300 a year. On low priced products the same sentence can shrink the purchase in the buyer's mind and cost you sales.
What is temporal reframing in pricing?
Temporal reframing is quoting one large expense as a series of small ones, like $300 a year restated as 85 cents a day, without changing what the buyer actually pays. Consumer psychologists have studied it since magazine publishers moved to per-issue pricing in the early 1980s. It lowers the perceived size of the price while the real price stays identical.
When does cost per use backfire on a product page?
When the divided number gets small enough to make the purchase feel trivial, or when the lifespan you divided by is optimistic. A $39 product at 65 cents a wash reads as a purchase not worth thinking about, which is the opposite of the urgency a low ticket page needs. And any lifespan claim a buyer can disprove turns the whole page into a sales pitch they stop trusting.
Where should cost per use go on a Shopify product page?
Directly under the price, in smaller type, as a plain sentence rather than a badge. It works as a second reading of the price the buyer is already looking at. Putting it in a marketing block halfway down the page means the buyer has already decided the price is too high and left before they reach the reframe.
Is cost per wear the same thing as cost per use?
Yes, cost per wear is the apparel version of the same calculation: purchase price divided by expected wears. Shopify apps exist purely to compute it on product pages, which is a fair signal that merchants see it working. The underlying math and the same failure modes apply to both.